Geekbench 5's database features a 14-core Alder Lake result.
Core i7-12700 'Alder Lake' Geekbenched: Faster Than Rocket Lake : Read more
Core i7-12700 'Alder Lake' Geekbenched: Faster Than Rocket Lake : Read more
it doesn't really make a lot of sense to compare what should be a 65W processor to chips that have a TDP that exceeds 100W
isnt this done frequently though?
The 5800x draws a tiny bit less power but is also a tiny bit slower than the 11700k.All the time, and by default, on most boards, OC is disabled.
I bet that the 5800x probably uses less power and overclocks itself less than that intel part.

The 5800x is a 105W TDP part according to AMD, and not 65W.
https://www.amd.com/en/products/cpu/amd-ryzen-7-5800x
The non-x 5800, OEM only part, is 65W TDP.
The 5800x draws a tiny bit less power but is also a tiny bit slower than the 11700k.
https://www.tomshardware.com/reviews/intel-core-i7-11700k-cpu-review/3

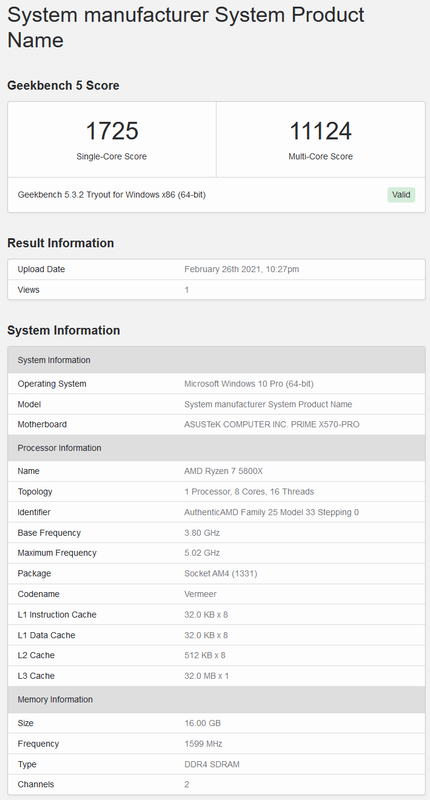
Same amount of cores and same power why would anybody care about the clocks?The 11700k is slower than the 5800X when you have the AMD chip also hitting 5Ghz and there is no clock speed advantage for intel. Also faster than this specific Alderlake chip in geek bench.
Same amount of cores and same power why would anybody care about the clocks?
Also how much power does the 5800x draw to get to 5Ghz? because obviously it already draws about 120W just with PBO.
Tom's shows the same power draw between the 11700k and the 5800x when the 5800x uses PBO, it's impossible to get a lot more clocks out of it with manual overclock without using a lot more power.The clocks matter for the benchmarks scores.
And I would assume only a few more watts I don't have anything here to check the power usage.
You keep posting the same thing but the fact of the matter is you are using wrong numbers. You compare the 5800X against the 11700K in performance but against the 10700K in power. I am surprised that nobody else has bothered to correct you so far. Here are the charts for power consumption with the 11700K included.The 5800x is a 105W TDP part according to AMD, and not 65W.
https://www.amd.com/en/products/cpu/amd-ryzen-7-5800x
The non-x 5800, OEM only part, is 65W TDP.
The 5800x draws a tiny bit less power but is also a tiny bit slower than the 11700k.
https://www.tomshardware.com/reviews/intel-core-i7-11700k-cpu-review/3

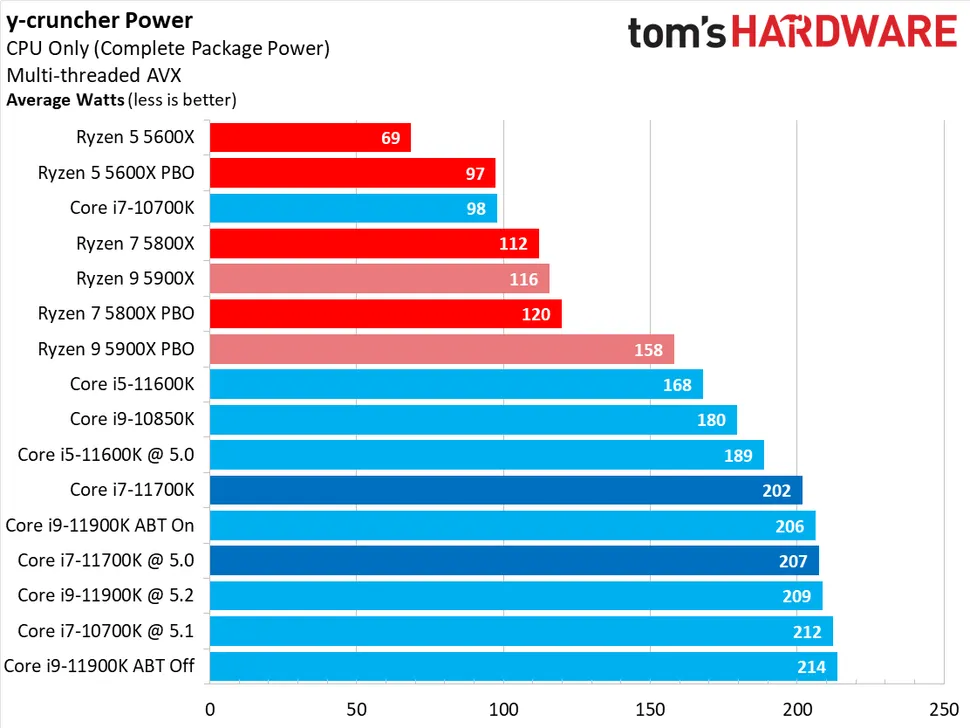
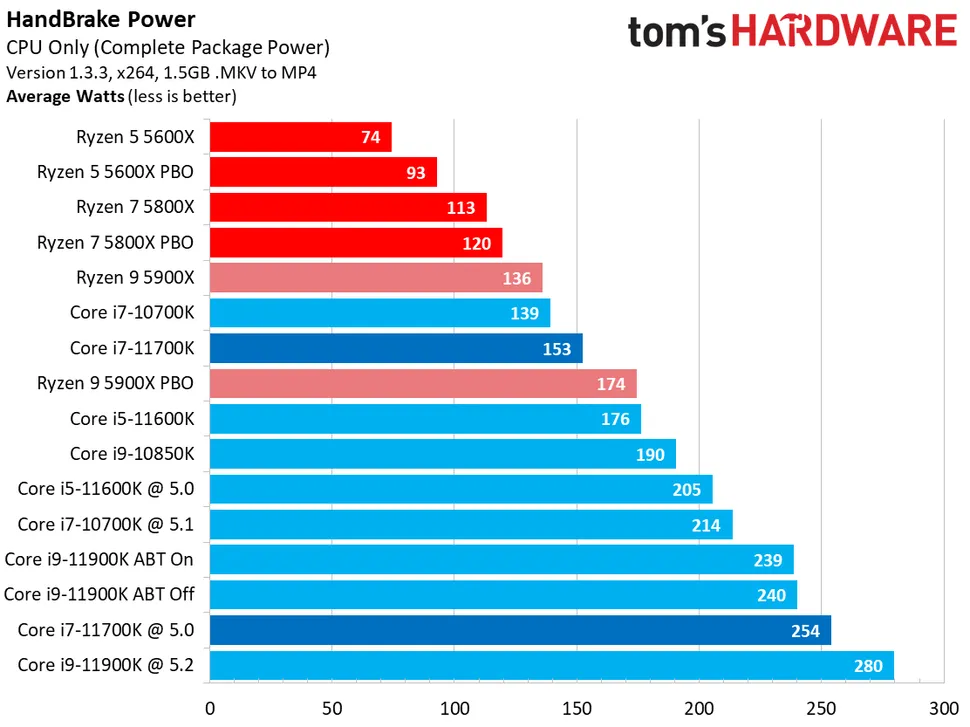
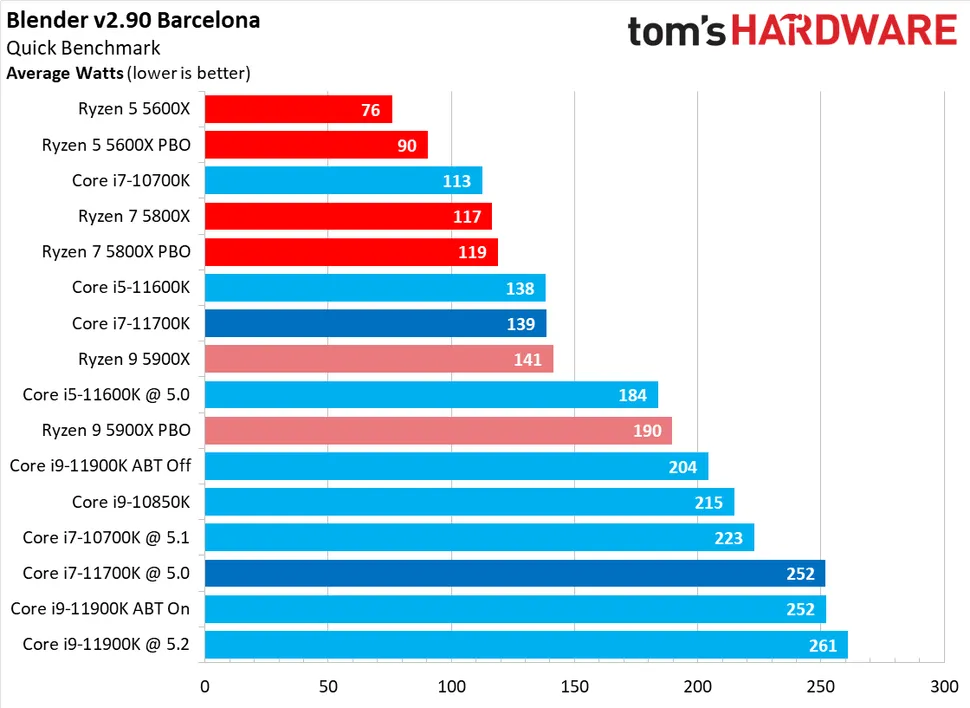
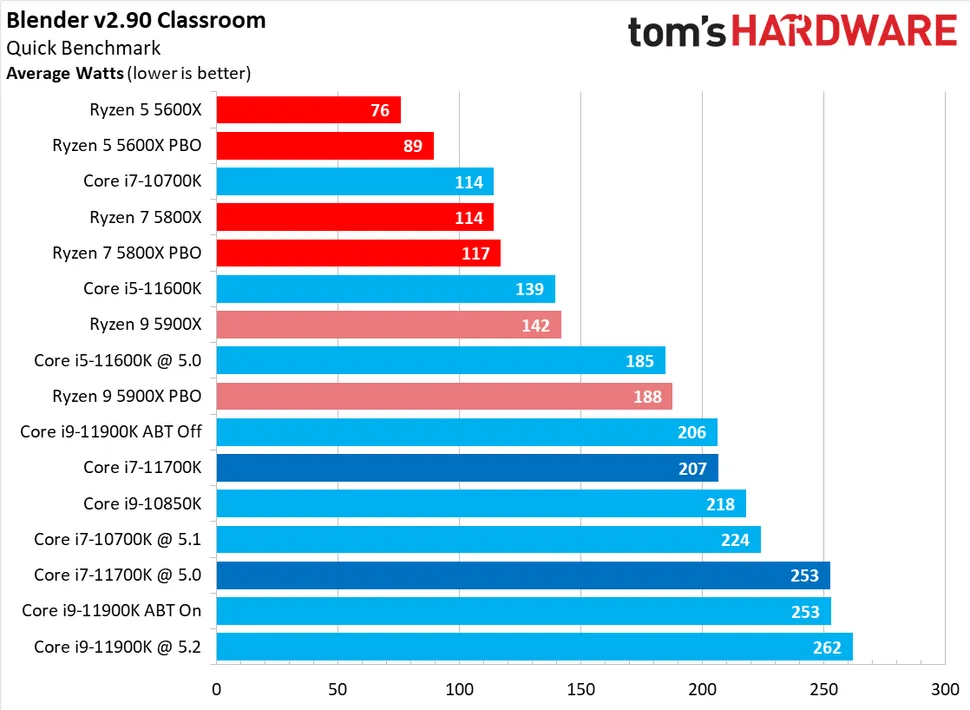
No, the average power draw of the 11700k is in the typed form right under the first image that shows the 11700k performance, it's 119W avg when power limits are followed.You keep posting the same thing but the fact of the matter is you are using wrong numbers. You compare the 5800X against the 11700K in performance but against the 10700K in power. I am surprised that nobody else has bothered to correct you so far. Here are the charts for power consumption with the 11700K included.


Below is the multithreaded-performance chart from Tom’s hardware review for the 11700K. In this chart there is no entry for the 11700K with power limits enforced. The score for 11700K (the 156.3) is without power limits. Tom’s Hardware does not benchmark and does not post scores with power limits enforced. The only time they test with power limits is in the power consumption segment only and they only post the power consumption figures.No, the average power draw of the 11700k is in the typed form right under the first image that shows the 11700k performance, it's 119W avg when power limits are followed.
What you posted is the highest load possible (AVX) with power limits lifted.
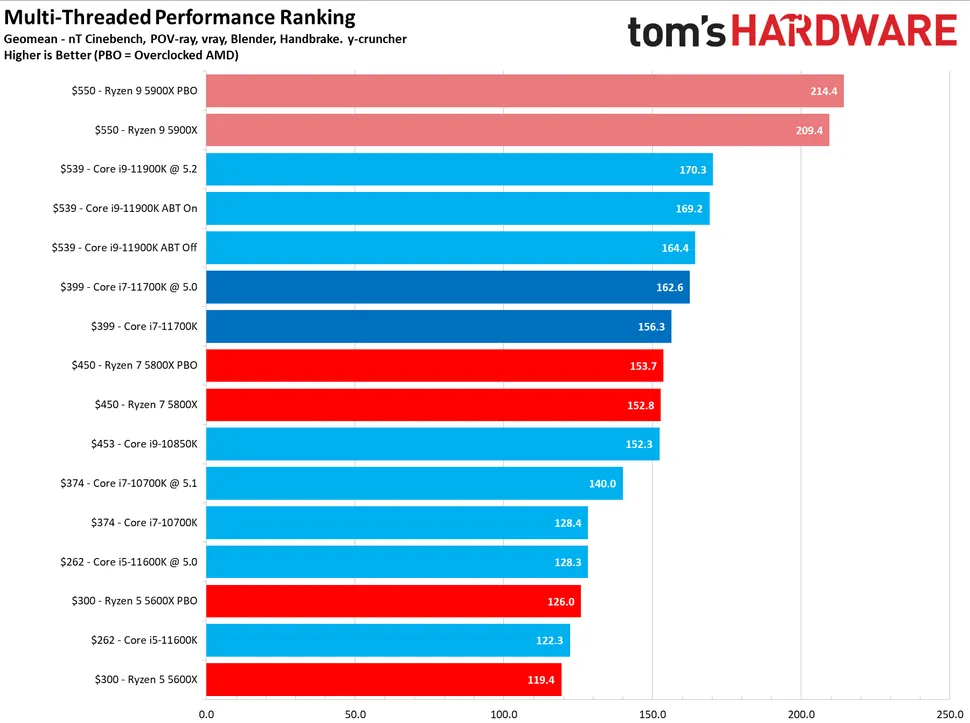
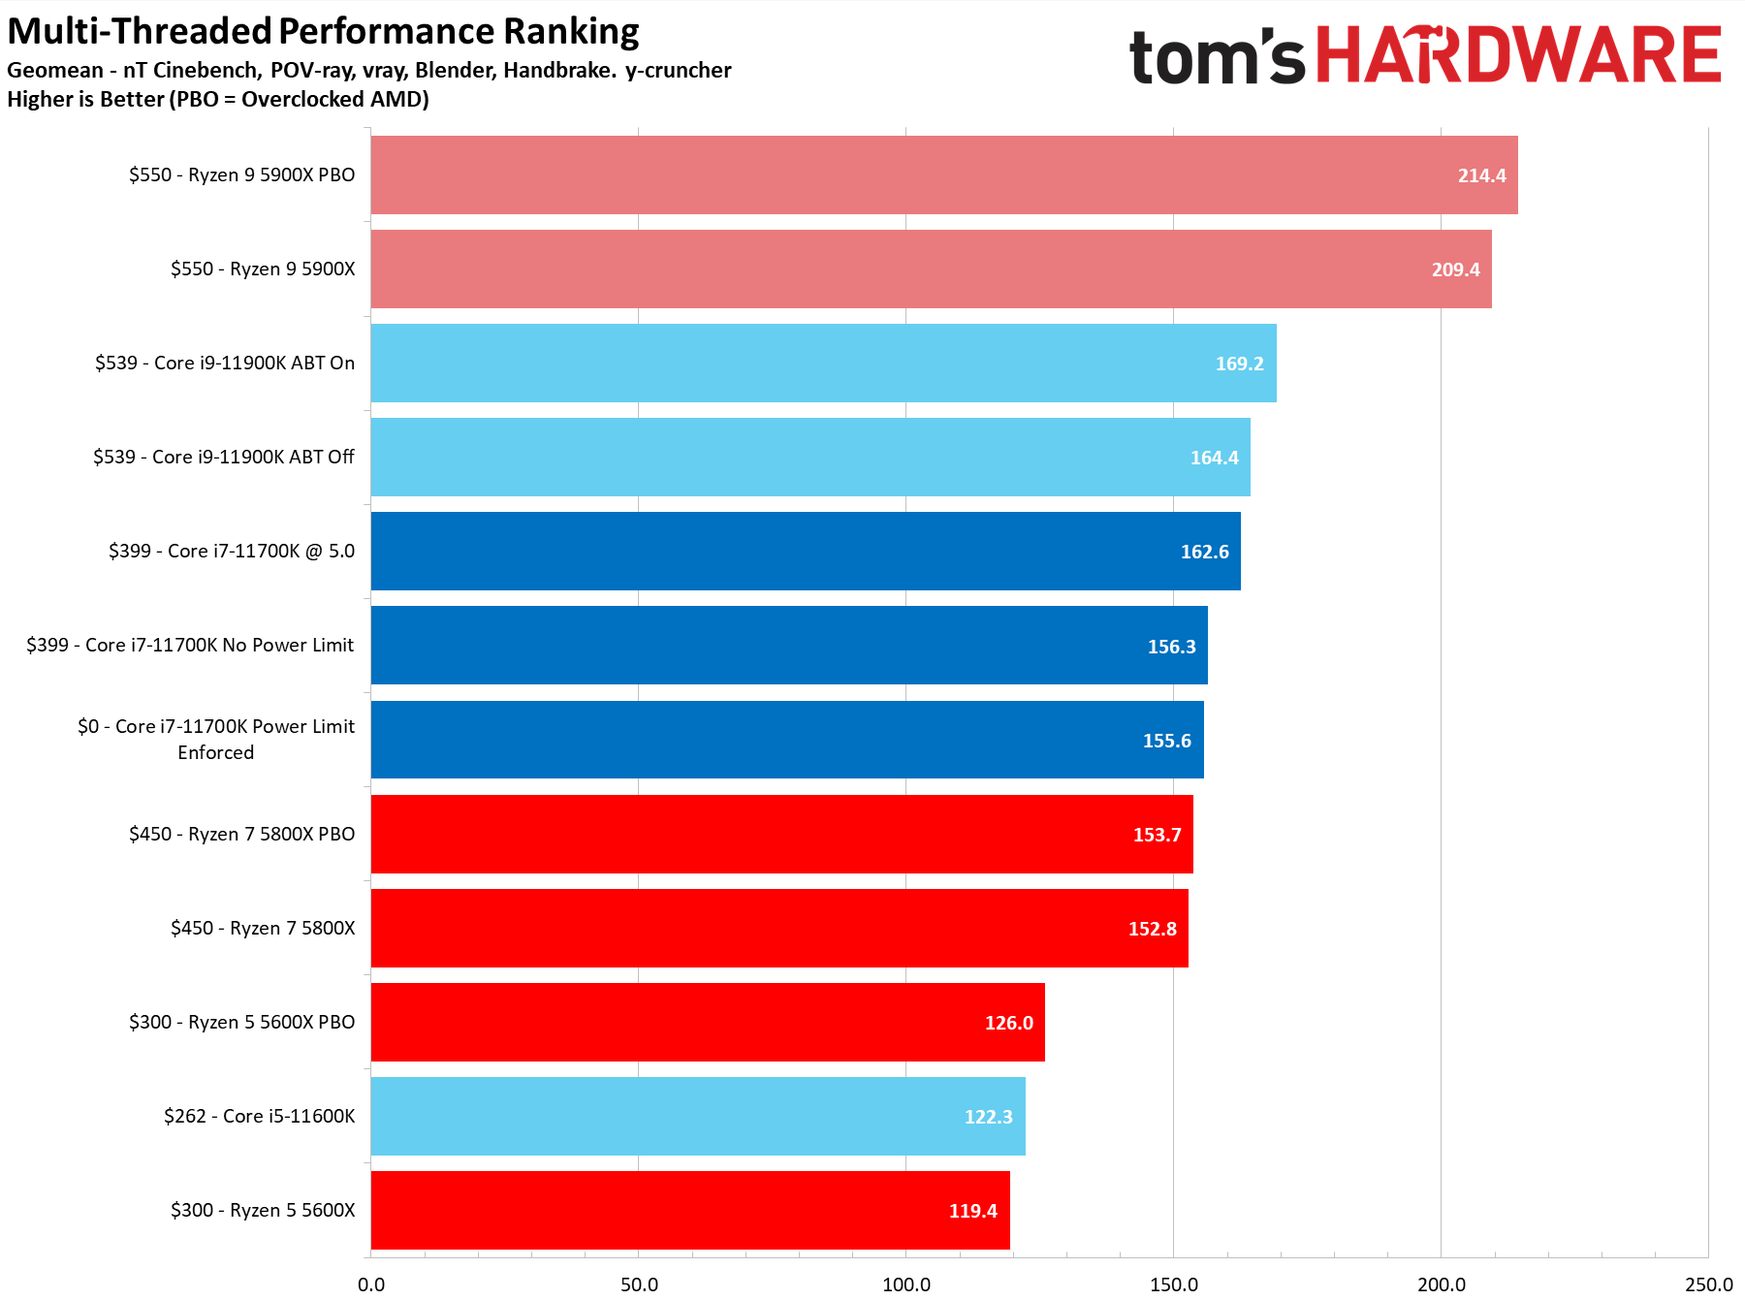
Yes, they did benchmark and post scores with power limits enforced for the 11700K, albeit for aggregated multi-threaded/single-threaded performance only. It's the first chart terrylaze posted above, from here: https://www.tomshardware.com/reviews/intel-core-i7-11700k-cpu-review/2Also below is the actual performance chart from Tom’s hardware review. In the chart below there is no entry for the 11700K with power limits enforced. The score for 11700K (the 156.3) is without power limits. Tom’s Hardware does not benchmark and does not post scores with power limits enforced. The only time they test with power limits is in the power consumption segment only and they only post the power consumption figures.
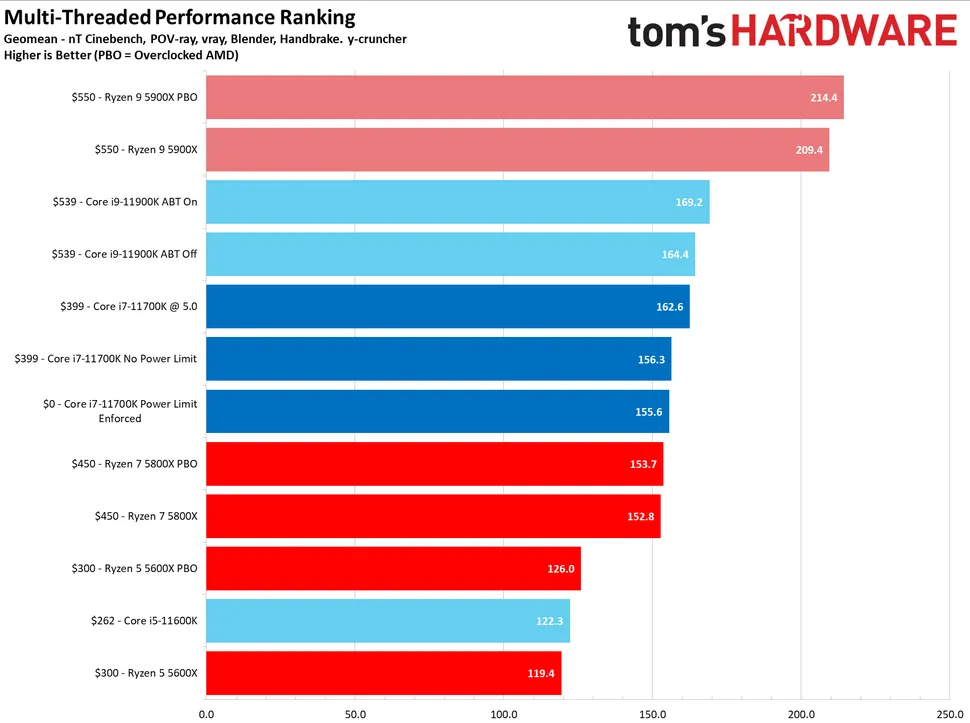
You can consult the charts above for test results highlighting the differences in performance, power, clock rates, and thermals for three operating modes: Stock settings with no power limits enforced, stock settings with power limits enforced, and an overclocked configuration (your mileage will vary based on cooling capabilities and power delivery).
I dispute the correctness of this chart. Why do the scores for the 11700K with power limits enforced not appear in the individual charts for these benchmarks? If Paul really also tested with power limits enforced why did he not post the scores in the individual charts? Yet he took their geomean to include in the general graph? Also the fact that the entry is titled $0-Core i7 11700K suggests to me that this was a placeholder entry that Paul never got around to actually test and mistakenly left there. This is further evidenced by the fact that the final chart doesn't include such an entry. Paul needs to clarify.Yes, they did benchmark and post scores with power limits enforced for the 11700K, albeit for aggregated multi-threaded/single-threaded performance only. It's the first chart terrylaze posted above, from here: https://www.tomshardware.com/reviews/intel-core-i7-11700k-cpu-review/2

From directly below that chart:
Because the final results are for people that barely know what a computer is, let alone know that there is such a thing as the bios, let alone let alone that they can change power settings in there.I dispute the correctness of this chart. Why do the scores for the 11700K with power limits enforced not appear in the individual charts for these benchmarks?
If Paul really also tested with power limits enforced why did he not post the scores in the individual charts?
He did a whole table for power draw and included enforced power limits, he also concluded that lifting power limits has only a 1% difference in performance, that doesn't happen by mistake.Yet he took their geomean to include in the general graph? Also the fact that the entry is titled $0-Core i7 11700K suggests to me that this was a placeholder entry that Paul never got around to actually test and mistakenly left there. This is further evidenced by the fact that the final chart doesn't include such an entry. Paul needs to clarify.
There really isn't much to chew over here. The 11700K performs exactly as we expect and frequently reaches its 5.0 GHz boost clock.
The multi-threaded series of tests runs the Corona ray-tracing benchmark, several HandBrake runs, POV-Ray, Cinebench R20, and four different Blender renders.
Average Power (Watts) Peak Power (Watts) Power Limits Enforced 119W 188W Power Limits Unlocked 150W 261W 5.0 GHz All-Core Overclock 223W 283W
Things are a bit more interesting in the multi-threaded tests. We don't see much of a performance improvement from lifting the power limits — the tests, which consist of a fixed unit of work, finish in roughly the same amount of time — but as you can see in the table above, we do see a big increase in power consumption. Keep in mind that increase in power yields less than 1% more performance, at least with our motherboard. That's a terrible tradeoff.
Very well, but even then both your argument and overall conclusion are still misguided and misleading. And here is why.Because the final results are for people that barely know what a computer is, let alone know that there is such a thing as the bios, let alone let alone that they can change power settings in there.
Anybody who wants to know all about the CPU has to actually read the whole review.
He did a whole table for power draw and included enforced power limits, he also concluded that lifting power limits has only a 1% difference in performance, that doesn't happen by mistake.
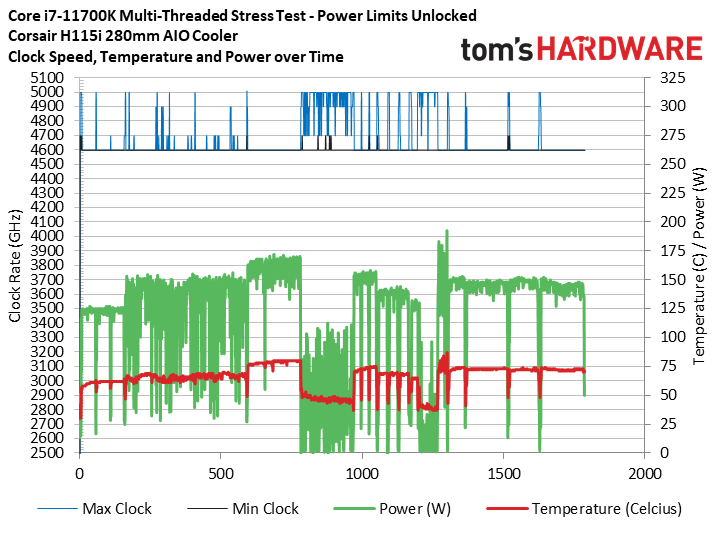
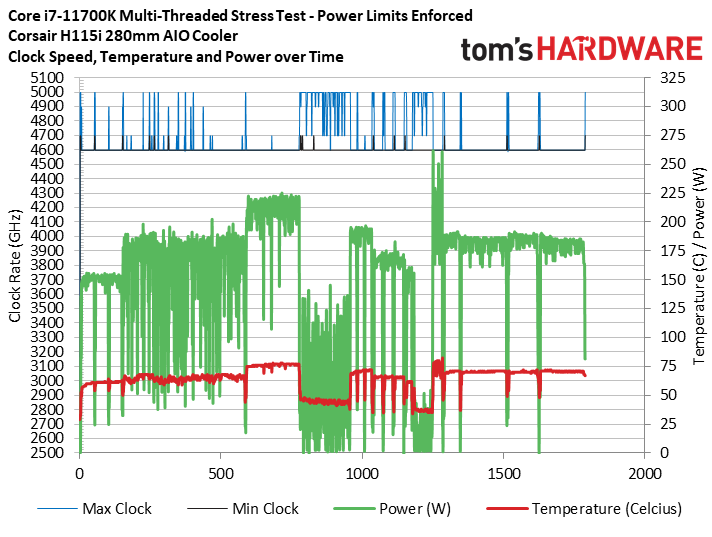
The whole concept of the power limit is that the CPU stays at TDP for the average, it doesn't matter what you run how you run it, if you leave time in-between or not.Furthermore the use of "average power" in your argument is misleading. The 4 blender tests were like 1360 seconds (around 23 minutes) in total. The other tests altogether were like 2-3 minutes in total. The 19 out of the 23 minutes in Blender were spent within the PL1 limit meaning that 19 out the 26 minutes, the CPU was forced to stay at 125W. Then if during the other 7 minutes it was boosting to 160W the “average” across all time would be around 134W. That’s not a geomean power across the workloads for which we calculated their geomean performance. It is an average dominated by the PL1 enforced during the longer Blender tests. What is more, is that Paul used the plots below to calculate the average power and in doing so not only did he overrepresented enforcing PL1 as opposed to performance (where PL1 enforcement is not a thing for 5 out of the 6 benchmarks), but he also allowed for power during idle time to be accounted as well, thereby reducing “average power” even further (to 119W).
Where do you see the durations of CB, y-cruncher, POV-ray, and V-ray? Or have you just run those yourself and know they're relatively short?Cinebench nT, y-cruncher, POV-ray and V-ray are all completed under 56 seconds. Also, the handbrake test (1.5GB .MKV to MP4) used takes less than 2 seconds, so again completed well within the time limit. And there were several such Handbrake tests. This then leaves only the four Blender tests (Barcelona, Koro, bmw27, Classroom) (which take between 2 to 8 minutes_ to not be entirely completed during the time limit. Even then for the first 56 seconds (i.e around 10-50% of the time) the 11700K was still allowed to use PL2.

