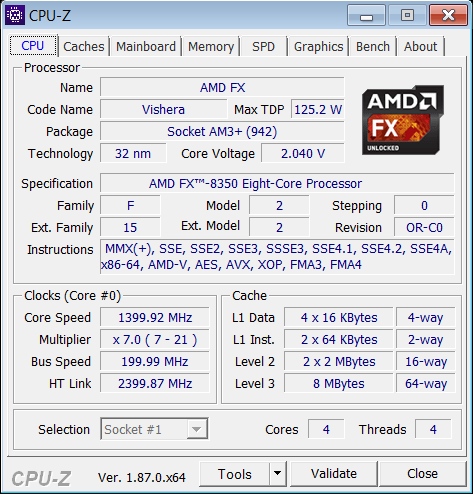
HWmonitor, Open hardware monitor, Realtemp, Speccy, Speedfan, Windows utilities, CPU-Z, NZXT CAM and most of the bundled motherboard utilities are often not the best choice as they are not always accurate. Some are actually grossly inaccurate, especially with certain chipsets or specific sensors that for whatever reason they tend to not like or work well with. I've found HWinfo or CoreTemp to be the MOST accurate with the broadest range of chipsets and sensors. They are also almost religiously kept up to date.
CoreTemp is great for just CPU thermals including core temps or distance to TJmax on AMD platforms.
HWinfo is great for pretty much EVERYTHING, including CPU thermals, core loads, core temps, package temps, GPU sensors, HDD and SSD sensors, motherboard chipset and VRM sensor, all of it. Always select the "Sensors only" option when running HWinfo.
In cases where it is relevant and you are seeking help, then in order to help you, it's often necessary to SEE what's going on, in the event one of us can pick something out that seems out of place, or other indicators that just can't be communicated via a text only post. In these cases, posting an image of the HWinfo sensors or something else can be extremely helpful. That may not be the case in YOUR thread, but if it is then the information at the following link will show you how to do that:
*How to post images in Tom's hardware forums
Run HWinfo and look at system voltages and other sensor readings.
Monitoring temperatures, core speeds, voltages, clock ratios and other reported sensor data can often help to pick out an issue right off the bat. HWinfo is a good way to get that data and in my experience tends to be more accurate than some of the other utilities available. CPU-Z, GPU-Z and Core Temp all have their uses but HWinfo tends to have it all laid out in a more convenient fashion so you can usually see what one sensor is reporting while looking at another instead of having to flip through various tabs that have specific groupings.
After installation, run the utility and when asked, choose "sensors only". The other window options have some use but in most cases everything you need will be located in the sensors window. If you're taking screenshots to post for troubleshooting, it will most likely require taking three screenshots and scrolling down the sensors window between screenshots in order to capture them all.
It is most helpful if you can take a series of HWinfo screenshots at idle, after a cold boot to the desktop. Open HWinfo and wait for all of the Windows startup processes to complete. Usually about four or five minutes should be plenty. Take screenshots of all the HWinfo sensors.
Next, run something demanding like Prime95 version 26.6 or Heaven benchmark. Take another set of screenshots while either of those is running so we can see what the hardware is doing while under a load.
 *Download HWinfo
For temperature monitoring only, I feel Core Temp is the most accurate and also offers a quick visual reference for core speed, load and CPU voltage:
 *Download Core Temp
"IF" temperature issues are relevant to your problem, especially if this is a build that has been running for a year or more, taking care of the basics first might save everybody involved a lot of time and frustration.
Check the CPU fan heatsink for dust accumulation and blow or clean out as necessary. Avoid using a vacuum if possible as vacuums are known to create static electricity that can, in some cases, zap small components.
Other areas that may benefit from a cleaning include fans, power supply internals, storage and optical drives, the motherboard surfaces and RAM. Keeping the inside of your rig clean is a high priority and should be done on a regular basis using 90 psi or lower compressed air from a compressor or compressed canned air.
Use common sense based on what PSU your compressor is set to. Don't "blast" your motherboard or hardware to pieces. Start from an adequate distance until you can judge what is enough to just get the job done. When using canned air use only short blasts moving from place to place frequently to avoid "frosting" components.


 *Download HWinfo
 *Download Core Temp