- Mar 8, 2016
- 309
- 3
- 18,795


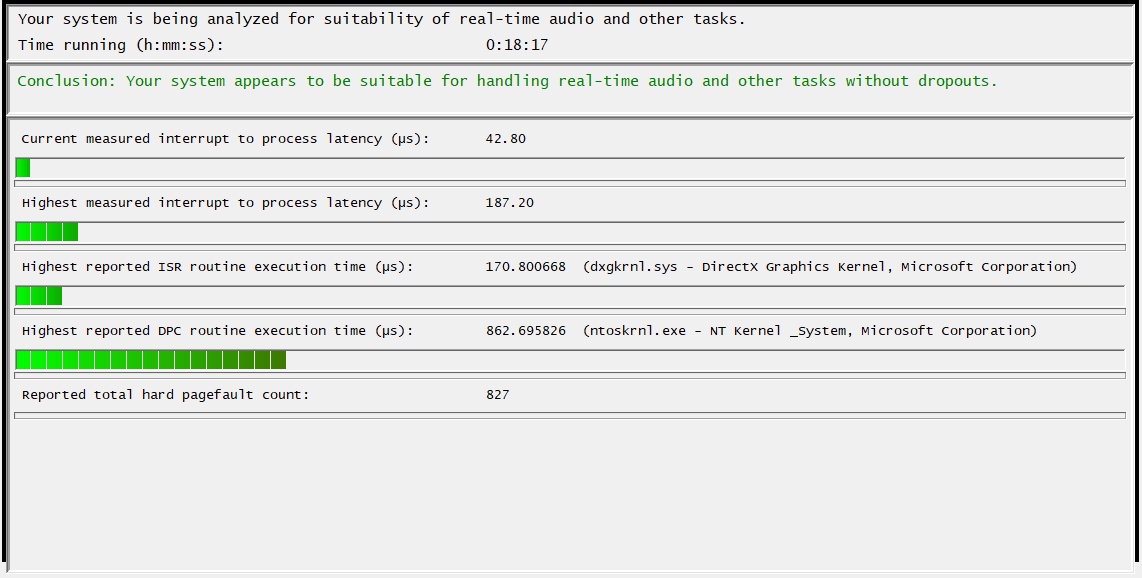
Hello ive been having some odd issues i have been noticing in games audio dropouts and some stuttering so i decided to test my latency and the results seem to be some high latency this is taken about 2 minutes after booting up my PC and im not sure what is causing it to be so high.
https://gyazo.com/e48bcbf967e13fa5d99b7d6c7f0f78d9
https://gyazo.com/993b073809d45597898deb6bbc53d2cb
https://gyazo.com/447bdcf182d26c817656b320364283b4
CONCLUSION
_
Your system appears to be having trouble handling real-time audio and other tasks. You are likely to experience buffer underruns appearing as drop outs, clicks or pops. One problem may be related to power management, disable CPU throttling settings in Control Panel and BIOS setup. Check for BIOS updates.
LatencyMon has been analyzing your system for 0:07:27 (h🇲🇲ss) on all processors.
_
SYSTEM INFORMATION
_
Computer name: MATTYBLUEEYES
OS version: Windows 11, 10.0, version 2009, build: 22621 (x64)
Hardware: Intel Z790 Ddr5, PCSpecialist
BIOS: 0813
CPU: GenuineIntel 13th Gen Intel(R) Core(TM) i9-13900K
Logical processors: 32
Processor groups: 1
Processor group size: 32
RAM: 32508 MB total
_
CPU SPEED
_
Reported CPU speed (WMI): 30 MHz
Reported CPU speed (registry): 2995 MHz
Note: reported execution times may be calculated based on a fixed reported CPU speed. Disable variable speed settings like Intel Speed Step and AMD Cool N Quiet in the BIOS setup for more accurate results.
_
MEASURED INTERRUPT TO USER PROCESS LATENCIES
_
The interrupt to process latency reflects the measured interval that a usermode process needed to respond to a hardware request from the moment the interrupt service routine started execution. This includes the scheduling and execution of a DPC routine, the signaling of an event and the waking up of a usermode thread from an idle wait state in response to that event.
Highest measured interrupt to process latency (µs): 74121.0
Average measured interrupt to process latency (µs): 24.108148
Highest measured interrupt to DPC latency (µs): 98.20
Average measured interrupt to DPC latency (µs): 1.041899
_
REPORTED ISRs
_
Interrupt service routines are routines installed by the OS and device drivers that execute in response to a hardware interrupt signal.
Highest ISR routine execution time (µs): 158.991653
Driver with highest ISR routine execution time: dxgkrnl.sys - DirectX Graphics Kernel, Microsoft Corporation
Highest reported total ISR routine time (%): 0.004332
Driver with highest ISR total time: dxgkrnl.sys - DirectX Graphics Kernel, Microsoft Corporation
Total time spent in ISRs (%) 0.004334
ISR count (execution time <250 µs): 37633
ISR count (execution time 250-500 µs): 0
ISR count (execution time 500-1000 µs): 0
ISR count (execution time 1000-2000 µs): 0
ISR count (execution time 2000-4000 µs): 0
ISR count (execution time >=4000 µs): 0
_
REPORTED DPCs
_
DPC routines are part of the interrupt servicing dispatch mechanism and disable the possibility for a process to utilize the CPU while it is interrupted until the DPC has finished execution.
Highest DPC routine execution time (µs): 331.310851
Driver with highest DPC routine execution time: nvlddmkm.sys - NVIDIA Windows Kernel Mode Driver, Version 528.49 , NVIDIA Corporation
Highest reported total DPC routine time (%): 0.003746
Driver with highest DPC total execution time: nvlddmkm.sys - NVIDIA Windows Kernel Mode Driver, Version 528.49 , NVIDIA Corporation
Total time spent in DPCs (%) 0.006299
DPC count (execution time <250 µs): 174232
DPC count (execution time 250-500 µs): 0
DPC count (execution time 500-10000 µs): 1
DPC count (execution time 1000-2000 µs): 0
DPC count (execution time 2000-4000 µs): 0
DPC count (execution time >=4000 µs): 0
_
REPORTED HARD PAGEFAULTS
_
Hard pagefaults are events that get triggered by making use of virtual memory that is not resident in RAM but backed by a memory mapped file on disk. The process of resolving the hard pagefault requires reading in the memory from disk while the process is interrupted and blocked from execution.
NOTE: some processes were hit by hard pagefaults. If these were programs producing audio, they are likely to interrupt the audio stream resulting in dropouts, clicks and pops. Check the Processes tab to see which programs were hit.
Process with highest pagefault count: systemsettings.exe
Total number of hard pagefaults 2156
Hard pagefault count of hardest hit process: 751
Number of processes hit: 31
_
PER CPU DATA
_
CPU 0 Interrupt cycle time (s): 32.899760
CPU 0 ISR highest execution time (µs): 0.0
CPU 0 ISR total execution time (s): 0.0
CPU 0 ISR count: 0
CPU 0 DPC highest execution time (µs): 151.911853
CPU 0 DPC total execution time (s): 0.205668
CPU 0 DPC count: 73801
_
CPU 1 Interrupt cycle time (s): 12.046563
CPU 1 ISR highest execution time (µs): 145.734891
CPU 1 ISR total execution time (s): 0.027231
CPU 1 ISR count: 1604
CPU 1 DPC highest execution time (µs): 50.974290
CPU 1 DPC total execution time (s): 0.024513
CPU 1 DPC count: 3211
_
CPU 2 Interrupt cycle time (s): 9.450006
CPU 2 ISR highest execution time (µs): 128.623038
CPU 2 ISR total execution time (s): 0.054238
CPU 2 ISR count: 3215
CPU 2 DPC highest execution time (µs): 331.310851
CPU 2 DPC total execution time (s): 0.052632
CPU 2 DPC count: 6733
_
CPU 3 Interrupt cycle time (s): 8.417413
CPU 3 ISR highest execution time (µs): 0.0
CPU 3 ISR total execution time (s): 0.0
CPU 3 ISR count: 0
CPU 3 DPC highest execution time (µs): 19.529215
CPU 3 DPC total execution time (s): 0.000058
CPU 3 DPC count: 21
_
CPU 4 Interrupt cycle time (s): 4.068941
CPU 4 ISR highest execution time (µs): 0.0
CPU 4 ISR total execution time (s): 0.0
CPU 4 ISR count: 0
CPU 4 DPC highest execution time (µs): 12.503506
CPU 4 DPC total execution time (s): 0.000084
CPU 4 DPC count: 35
_
CPU 5 Interrupt cycle time (s): 4.132782
CPU 5 ISR highest execution time (µs): 0.0
CPU 5 ISR total execution time (s): 0.0
CPU 5 ISR count: 0
CPU 5 DPC highest execution time (µs): 2.729215
CPU 5 DPC total execution time (s): 0.000009
CPU 5 DPC count: 5
_
CPU 6 Interrupt cycle time (s): 5.222007
CPU 6 ISR highest execution time (µs): 26.410017
CPU 6 ISR total execution time (s): 0.002371
CPU 6 ISR count: 144
CPU 6 DPC highest execution time (µs): 125.612020
CPU 6 DPC total execution time (s): 0.002576
CPU 6 DPC count: 309
_
CPU 7 Interrupt cycle time (s): 5.106955
CPU 7 ISR highest execution time (µs): 0.0
CPU 7 ISR total execution time (s): 0.0
CPU 7 ISR count: 0
CPU 7 DPC highest execution time (µs): 8.645075
CPU 7 DPC total execution time (s): 0.000089
CPU 7 DPC count: 40
_
CPU 8 Interrupt cycle time (s): 9.122268
CPU 8 ISR highest execution time (µs): 1.346912
CPU 8 ISR total execution time (s): 0.000262
CPU 8 ISR count: 859
CPU 8 DPC highest execution time (µs): 156.044073
CPU 8 DPC total execution time (s): 0.061022
CPU 8 DPC count: 12426
_
CPU 9 Interrupt cycle time (s): 10.685728
CPU 9 ISR highest execution time (µs): 141.861102
CPU 9 ISR total execution time (s): 0.275037
CPU 9 ISR count: 16396
CPU 9 DPC highest execution time (µs): 153.535225
CPU 9 DPC total execution time (s): 0.275996
CPU 9 DPC count: 37366
_
CPU 10 Interrupt cycle time (s): 6.646642
CPU 10 ISR highest execution time (µs): 158.991653
CPU 10 ISR total execution time (s): 0.258521
CPU 10 ISR count: 15198
CPU 10 DPC highest execution time (µs): 136.254424
CPU 10 DPC total execution time (s): 0.262727
CPU 10 DPC count: 36677
_
CPU 11 Interrupt cycle time (s): 8.703237
CPU 11 ISR highest execution time (µs): 0.806010
CPU 11 ISR total execution time (s): 0.000027
CPU 11 ISR count: 82
CPU 11 DPC highest execution time (µs): 149.035058
CPU 11 DPC total execution time (s): 0.009346
CPU 11 DPC count: 2118
_
CPU 12 Interrupt cycle time (s): 4.218668
CPU 12 ISR highest execution time (µs): 0.0
CPU 12 ISR total execution time (s): 0.0
CPU 12 ISR count: 0
CPU 12 DPC highest execution time (µs): 20.500167
CPU 12 DPC total execution time (s): 0.000492
CPU 12 DPC count: 339
_
CPU 13 Interrupt cycle time (s): 4.117327
CPU 13 ISR highest execution time (µs): 0.0
CPU 13 ISR total execution time (s): 0.0
CPU 13 ISR count: 0
CPU 13 DPC highest execution time (µs): 7.913856
CPU 13 DPC total execution time (s): 0.000021
CPU 13 DPC count: 7
_
CPU 14 Interrupt cycle time (s): 5.105180
CPU 14 ISR highest execution time (µs): 115.060434
CPU 14 ISR total execution time (s): 0.002826
CPU 14 ISR count: 135
CPU 14 DPC highest execution time (µs): 122.564274
CPU 14 DPC total execution time (s): 0.003055
CPU 14 DPC count: 438
_
CPU 15 Interrupt cycle time (s): 5.026749
CPU 15 ISR highest execution time (µs): 0.0
CPU 15 ISR total execution time (s): 0.0
CPU 15 ISR count: 0
CPU 15 DPC highest execution time (µs): 19.146578
CPU 15 DPC total execution time (s): 0.000108
CPU 15 DPC count: 39
_
CPU 16 Interrupt cycle time (s): 2.292547
CPU 16 ISR highest execution time (µs): 0.0
CPU 16 ISR total execution time (s): 0.0
CPU 16 ISR count: 0
CPU 16 DPC highest execution time (µs): 34.674457
CPU 16 DPC total execution time (s): 0.000272
CPU 16 DPC count: 54
_
CPU 17 Interrupt cycle time (s): 2.147433
CPU 17 ISR highest execution time (µs): 0.0
CPU 17 ISR total execution time (s): 0.0
CPU 17 ISR count: 0
CPU 17 DPC highest execution time (µs): 49.941903
CPU 17 DPC total execution time (s): 0.000619
CPU 17 DPC count: 79
_
CPU 18 Interrupt cycle time (s): 1.847665
CPU 18 ISR highest execution time (µs): 0.0
CPU 18 ISR total execution time (s): 0.0
CPU 18 ISR count: 0
CPU 18 DPC highest execution time (µs): 33.889149
CPU 18 DPC total execution time (s): 0.000178
CPU 18 DPC count: 36
_
CPU 19 Interrupt cycle time (s): 1.648808
CPU 19 ISR highest execution time (µs): 0.0
CPU 19 ISR total execution time (s): 0.0
CPU 19 ISR count: 0
CPU 19 DPC highest execution time (µs): 37.674124
CPU 19 DPC total execution time (s): 0.000232
CPU 19 DPC count: 33
_
CPU 20 Interrupt cycle time (s): 2.524373
CPU 20 ISR highest execution time (µs): 0.0
CPU 20 ISR total execution time (s): 0.0
CPU 20 ISR count: 0
CPU 20 DPC highest execution time (µs): 36.072120
CPU 20 DPC total execution time (s): 0.000170
CPU 20 DPC count: 40
_
CPU 21 Interrupt cycle time (s): 2.429871
CPU 21 ISR highest execution time (µs): 0.0
CPU 21 ISR total execution time (s): 0.0
CPU 21 ISR count: 0
CPU 21 DPC highest execution time (µs): 33.557930
CPU 21 DPC total execution time (s): 0.00010
CPU 21 DPC count: 28
_
CPU 22 Interrupt cycle time (s): 2.165214
CPU 22 ISR highest execution time (µs): 0.0
CPU 22 ISR total execution time (s): 0.0
CPU 22 ISR count: 0
CPU 22 DPC highest execution time (µs): 46.080801
CPU 22 DPC total execution time (s): 0.000197
CPU 22 DPC count: 41
_
CPU 23 Interrupt cycle time (s): 1.958398
CPU 23 ISR highest execution time (µs): 0.0
CPU 23 ISR total execution time (s): 0.0
CPU 23 ISR count: 0
CPU 23 DPC highest execution time (µs): 30.361937
CPU 23 DPC total execution time (s): 0.000079
CPU 23 DPC count: 18
_
CPU 24 Interrupt cycle time (s): 2.328761
CPU 24 ISR highest execution time (µs): 0.0
CPU 24 ISR total execution time (s): 0.0
CPU 24 ISR count: 0
CPU 24 DPC highest execution time (µs): 32.925543
CPU 24 DPC total execution time (s): 0.000232
CPU 24 DPC count: 56
_
CPU 25 Interrupt cycle time (s): 2.132507
CPU 25 ISR highest execution time (µs): 0.0
CPU 25 ISR total execution time (s): 0.0
CPU 25 ISR count: 0
CPU 25 DPC highest execution time (µs): 31.278798
CPU 25 DPC total execution time (s): 0.000073
CPU 25 DPC count: 13
_
CPU 26 Interrupt cycle time (s): 1.968226
CPU 26 ISR highest execution time (µs): 0.0
CPU 26 ISR total execution time (s): 0.0
CPU 26 ISR count: 0
CPU 26 DPC highest execution time (µs): 32.683139
CPU 26 DPC total execution time (s): 0.000173
CPU 26 DPC count: 46
_
CPU 27 Interrupt cycle time (s): 1.779872
CPU 27 ISR highest execution time (µs): 0.0
CPU 27 ISR total execution time (s): 0.0
CPU 27 ISR count: 0
CPU 27 DPC highest execution time (µs): 16.349917
CPU 27 DPC total execution time (s): 0.000155
CPU 27 DPC count: 60
_
CPU 28 Interrupt cycle time (s): 2.245764
CPU 28 ISR highest execution time (µs): 0.0
CPU 28 ISR total execution time (s): 0.0
CPU 28 ISR count: 0
CPU 28 DPC highest execution time (µs): 46.407346
CPU 28 DPC total execution time (s): 0.000405
CPU 28 DPC count: 63
_
CPU 29 Interrupt cycle time (s): 2.101418
CPU 29 ISR highest execution time (µs): 0.0
CPU 29 ISR total execution time (s): 0.0
CPU 29 ISR count: 0
CPU 29 DPC highest execution time (µs): 8.727880
CPU 29 DPC total execution time (s): 0.000080
CPU 29 DPC count: 31
_
CPU 30 Interrupt cycle time (s): 1.890082
CPU 30 ISR highest execution time (µs): 0.0
CPU 30 ISR total execution time (s): 0.0
CPU 30 ISR count: 0
CPU 30 DPC highest execution time (µs): 32.846745
CPU 30 DPC total execution time (s): 0.000158
CPU 30 DPC count: 31
_
CPU 31 Interrupt cycle time (s): 1.787435
CPU 31 ISR highest execution time (µs): 0.0
CPU 31 ISR total execution time (s): 0.0
CPU 31 ISR count: 0
CPU 31 DPC highest execution time (µs): 39.071119
CPU 31 DPC total execution time (s): 0.000228
CPU 31 DPC count: 39
_
I am going to further test during game but when playing rdr2 i have tested it before and the levels were high but definitely not as high as shown in the first image