I think the only real issue with the new legacy, for those of us lunatics* still looking at these GPU fossils, is that, a lot of the time (but not every time), the GFLOPS score seems to be independent of the memory type. Don't get me wrong, though, as that disclaimer is literally mentioned right up front in the opening paragraph for that chart.
*and yes, while I was looking at it, I briefly wondered how the old HD 4850 I once had compared to the HD 6670 that I still have lying around somewhere... I think something might be wrong with me.
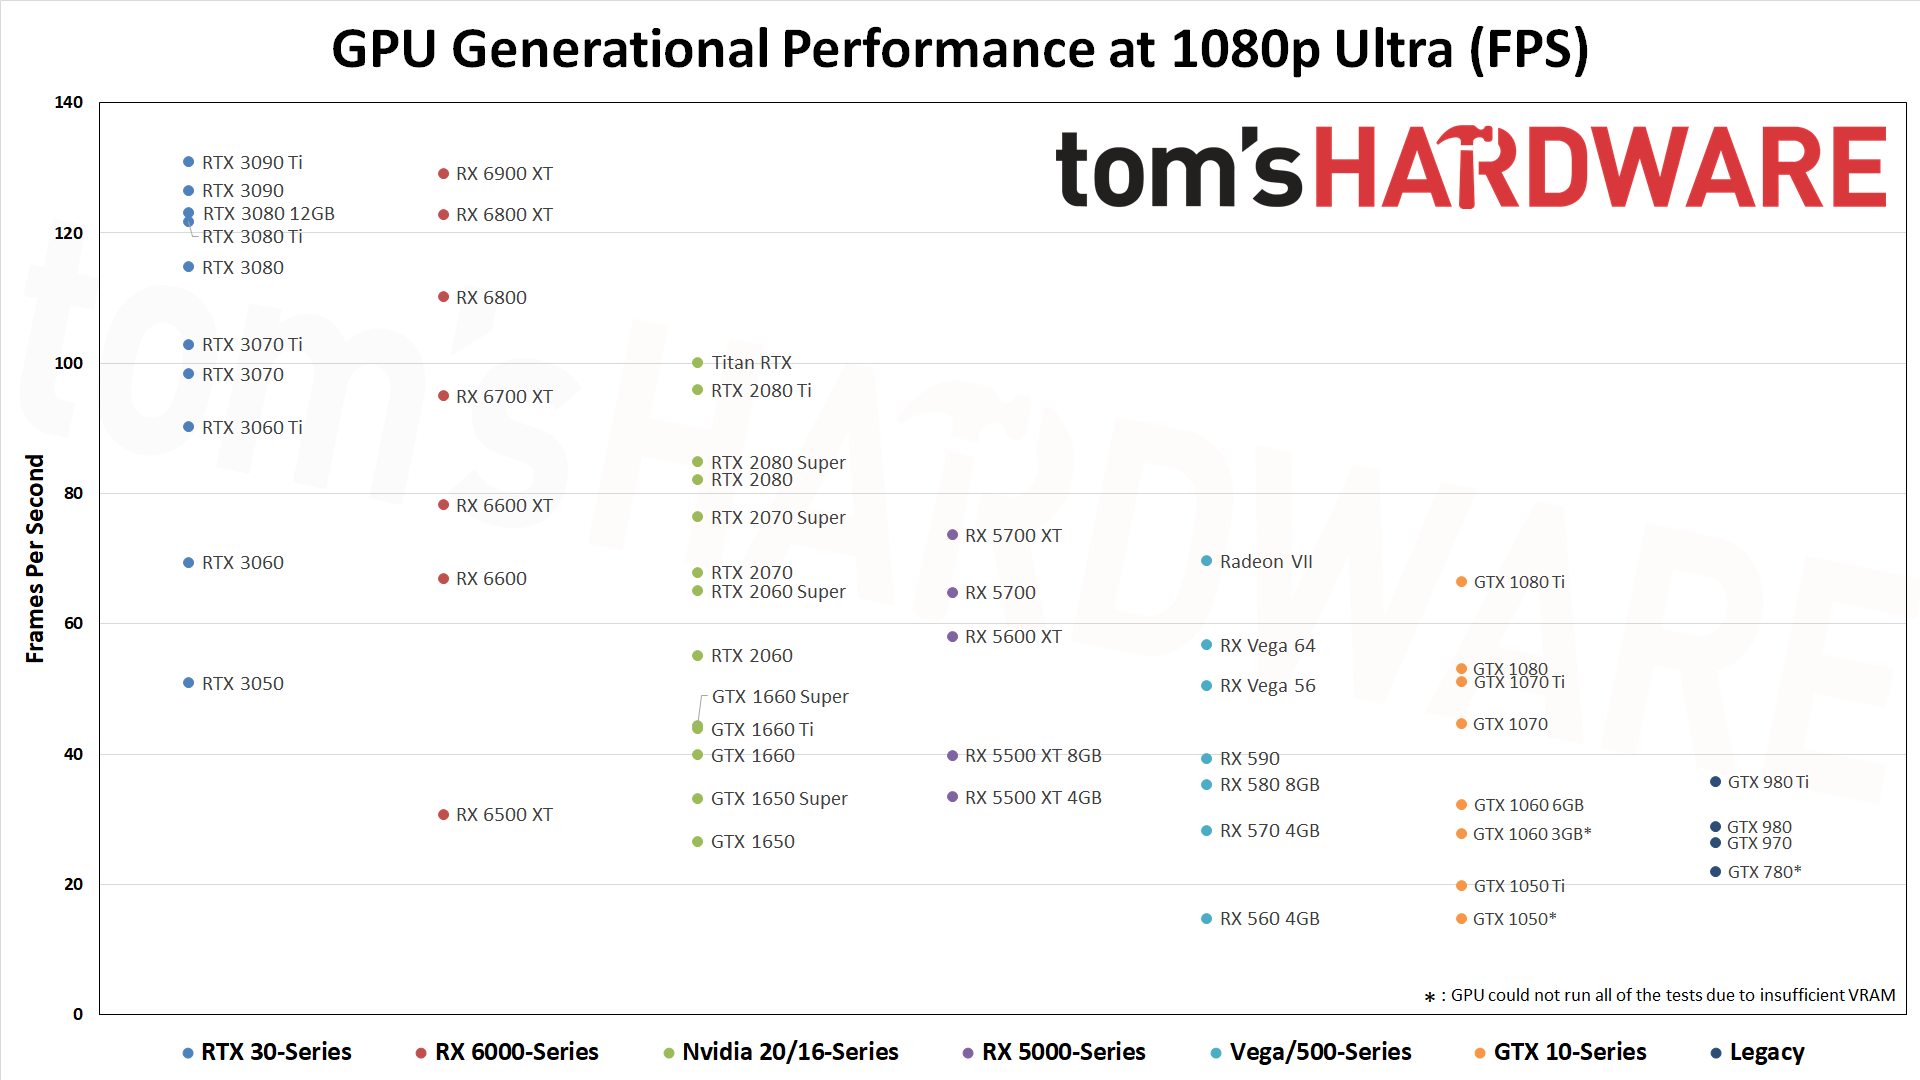
I need to move on from the ancient days . . there are even "modern" cards that fail gaming tests because of insufficient VRAM!
A shame they didn't really document the methodology, or where guesswork was required. I sort of remember the "if the new card is within 3 tiers of the old card, you probably won't see much of a difference," though I think even that cautionary statement became quite inaccurate in the later generations of cards.
Honestly, as the guy who came into TH just over two years ago and took over the hierarchy and testing, the old methodology was at best highly suspect. Pre-2020, for example, the GPU hierarchy used testing from just three games. I believe those were Ashes of the Singularity, Forza Horizon 4, and Shadow of the Tomb Raider. Ashes is a terrible GPU benchmark, as it often ends up CPU limited, Forza heavily favored AMD GPUs, and Shadow was the only game I felt came close to putting AMD and Nvidia GPUs on equal footing (without DXR enabled, at least). That was the 2019 iteration, and you can guess that things weren't any better with previous versions of the GPU testing. It's one of the reasons TH wanted me to come on board, because I would actually do a huge amount of testing.
But again, I posted the old "legacy" list on the previous page. Let me call out a few massive discrepancies just to point out the problems. The dual-GPU solutions aren't always included, but when they are, placement is highly suspect. GTX 690 sits right below GTX 980, which sits in a bracket above GTX 1060 6GB. Then you get the GTX Titan, 1060 3GB, 970, 780 Ti, and 770 before we finally get the GTX 680. Was the dual-GPU really eight positions ahead of the single GPU variant? Maybe in 3DMark, but not in most modern games and only a handful of older games that had good SLI support.
Part of the problem is that there's no indication of what one "rank" in the listing means, though. Sometimes two cards are adjacent and are basically tied in performance, other times there might be as much as a 10% performance gap between two line. And it varies throughout the listings.
On the AMD side, the R9 295X2 sits above Vega 56, but one tier below Vega 64... even though there's only a 10% gap between the two Vega GPUs. Then comes Fury X, Fury, Fury Nano, 580 8GB (no 590), 480 8GB, 570 4G and "570 4GB" (what's the difference!?), 390X, 390, and finally 290X. That means the dual-GPU 295X2 got 11 positions higher than the single-GPU variant, and three "tiers" (groupings) higher. It's nonsensical!
Or how about the HD 7970 (GHz edition as a bonus!). The vanilla 7970 isn't listed in the old legacy hierarchy, but the GHz is a "tier" (grouping) above the R9 280, whereas the 280X sits right above the HD 7970 GHz. Except all of those use the exact same Tahiti GPU, and the 7970 GHz had the highest clocks of them all (1050 MHz boost, compared to 1000 MHz on the 280X).
I could have tried to do a weighted sorting, where GFLOPS was combined with VRAM bandwidth and capacity plus an "architectural scaling factor" (so maybe 1.0x for GCN1.4, 1.1x for Pascal, whatever...) That gets very nebulous and starts to imply actual benchmarks, however, so I just left it with theoretical GFLOPS and then listed a few specs next to the GPU. Adding VRAM capacity and bandwidth to the columns might be worth the effort, if I have a day where I'm bored. LOL