Dear all,
For the last year i have had on and off trouble with my PC. Sometimes the problem is gone for a few weeks/months, making me believe I solved it, but then the issue comes back again, and it is driving me crazy.
During usage my pc ramdomly crashes, in around 50% of the cases I get a BSOD screen, the most common being Kmode_exception_not_handled, which I let windows handle it till it goes to restart. The other half of the time everything freezes, and my screen (either goes black, or stuck on what it was displaying, but jumping around over the screen) and sound start freaking out, and the only solution is to cut the power. In both cases the PC refuses to restart (fans start running, screen activates but stays black, fans calm down and nothing happens anymore till i cut the power again, I won't even get the Asus screen) till half a hour to (worst case) 2 days later.
Things I tried to fix the issue:
disabled fast start-up
SFC-scan - no errors
replaced afd.sys (since who-chrashed said it was the culprit on one occasion)
Windows memory diagnostics - no errors
Memtest86 - 8 passes - no errors
fully updated the OS using windows update
re-install of win10
manually updated every driver using device manager->search online for best driver
manually updated my Intel-drivers using their site (since it said somewhere that the Intel networkdriver was the most likely culprit.
I tried using Tweakbits driverupdater, but my antivirus (NOD32) kept nagging me about it en it didnt seem to work since it detected exactly 0 drivers on my pc.
System:
ASUS all-in-one Z240IC PC series
Windows version: Windows 10 , 10.0, build: 18363
Windows dir: C:\WINDOWS
Hardware: Z240IC-H170, ASUSTeK COMPUTER INC.
CPU: GenuineIntel Intel(R) Core(TM) i7-6700T CPU @ 2.80GHz Intel8664, level: 6
8 logical processors, active mask: 255
RAM: 8440692736 bytes (7,9GB)
NVIDIA GeForce GTX 960m
BIOS Version/Date: American Megatrends Inc. 0704, 7-3-2016
note: I can't open up my pc as it is an all-in-one, and opening it up would damage the system (critical designflaw by asus IMO, didnt know this till after I had bought the system )
)
Who crashed error analysis:
Dumpfiles:
dumpfiles on filebin
My thanks in advance for the help, I hope we can solve it fast.
Kind regards
-Maarten
For the last year i have had on and off trouble with my PC. Sometimes the problem is gone for a few weeks/months, making me believe I solved it, but then the issue comes back again, and it is driving me crazy.
During usage my pc ramdomly crashes, in around 50% of the cases I get a BSOD screen, the most common being Kmode_exception_not_handled, which I let windows handle it till it goes to restart. The other half of the time everything freezes, and my screen (either goes black, or stuck on what it was displaying, but jumping around over the screen) and sound start freaking out, and the only solution is to cut the power. In both cases the PC refuses to restart (fans start running, screen activates but stays black, fans calm down and nothing happens anymore till i cut the power again, I won't even get the Asus screen) till half a hour to (worst case) 2 days later.
Things I tried to fix the issue:
disabled fast start-up
SFC-scan - no errors
replaced afd.sys (since who-chrashed said it was the culprit on one occasion)
Windows memory diagnostics - no errors
Memtest86 - 8 passes - no errors
fully updated the OS using windows update
re-install of win10
manually updated every driver using device manager->search online for best driver
manually updated my Intel-drivers using their site (since it said somewhere that the Intel networkdriver was the most likely culprit.
I tried using Tweakbits driverupdater, but my antivirus (NOD32) kept nagging me about it en it didnt seem to work since it detected exactly 0 drivers on my pc.
System:
ASUS all-in-one Z240IC PC series
Windows version: Windows 10 , 10.0, build: 18363
Windows dir: C:\WINDOWS
Hardware: Z240IC-H170, ASUSTeK COMPUTER INC.
CPU: GenuineIntel Intel(R) Core(TM) i7-6700T CPU @ 2.80GHz Intel8664, level: 6
8 logical processors, active mask: 255
RAM: 8440692736 bytes (7,9GB)
NVIDIA GeForce GTX 960m
BIOS Version/Date: American Megatrends Inc. 0704, 7-3-2016
note: I can't open up my pc as it is an all-in-one, and opening it up would damage the system (critical designflaw by asus IMO, didnt know this till after I had bought the system
)Who crashed error analysis:
On Sat 8-2-2020 10:33:11 your computer crashed or a problem was reported
crash dump file: C:\WINDOWS\Minidump\020820-31359-01.dmp
This was probably caused by the following module: ntoskrnl.exe (nt+0x1C14E0)
Bugcheck code: 0x3D (0xFFFFF80167669D28, 0xFFFFF80167669570, 0x0, 0x0)
Error: INTERRUPT_EXCEPTION_NOT_HANDLED
file path: C:\WINDOWS\system32\ntoskrnl.exe
product: Microsoft® Windows® Operating System
company: Microsoft Corporation
description: NT Kernel & System
Bug check description: This bug check appears very infrequently.
The crash took place in the Windows kernel. Possibly this problem is caused by another driver that cannot be identified at this time.
On Sat 8-2-2020 10:33:11 your computer crashed or a problem was reported
crash dump file: C:\WINDOWS\MEMORY.DMP
This was probably caused by the following module: ntkrnlmp.exe (nt!KeSetEventBoostPriority+0x55)
Bugcheck code: 0x3D (0xFFFFF80167669D28, 0xFFFFF80167669570, 0x0, 0x0)
Error: INTERRUPT_EXCEPTION_NOT_HANDLED
Bug check description: This bug check appears very infrequently.
The crash took place in the Windows kernel. Possibly this problem is caused by another driver that cannot be identified at this time.
On Sun 2-2-2020 02:33:27 your computer crashed or a problem was reported
crash dump file: C:\WINDOWS\Minidump\020220-31203-01.dmp
This was probably caused by the following module: unknown_module_0000000000010000.sys (0xFFFFFFFFFFFFFFFF)
Bugcheck code: 0x1E (0xFFFFFFFFC0000005, 0xFFFFF8073D7C82C5, 0x0, 0xFFFFFFFFFFFFFFFF)
Error: KMODE_EXCEPTION_NOT_HANDLED
Bug check description: This indicates that a kernel-mode program generated an exception which the error handler did not catch.
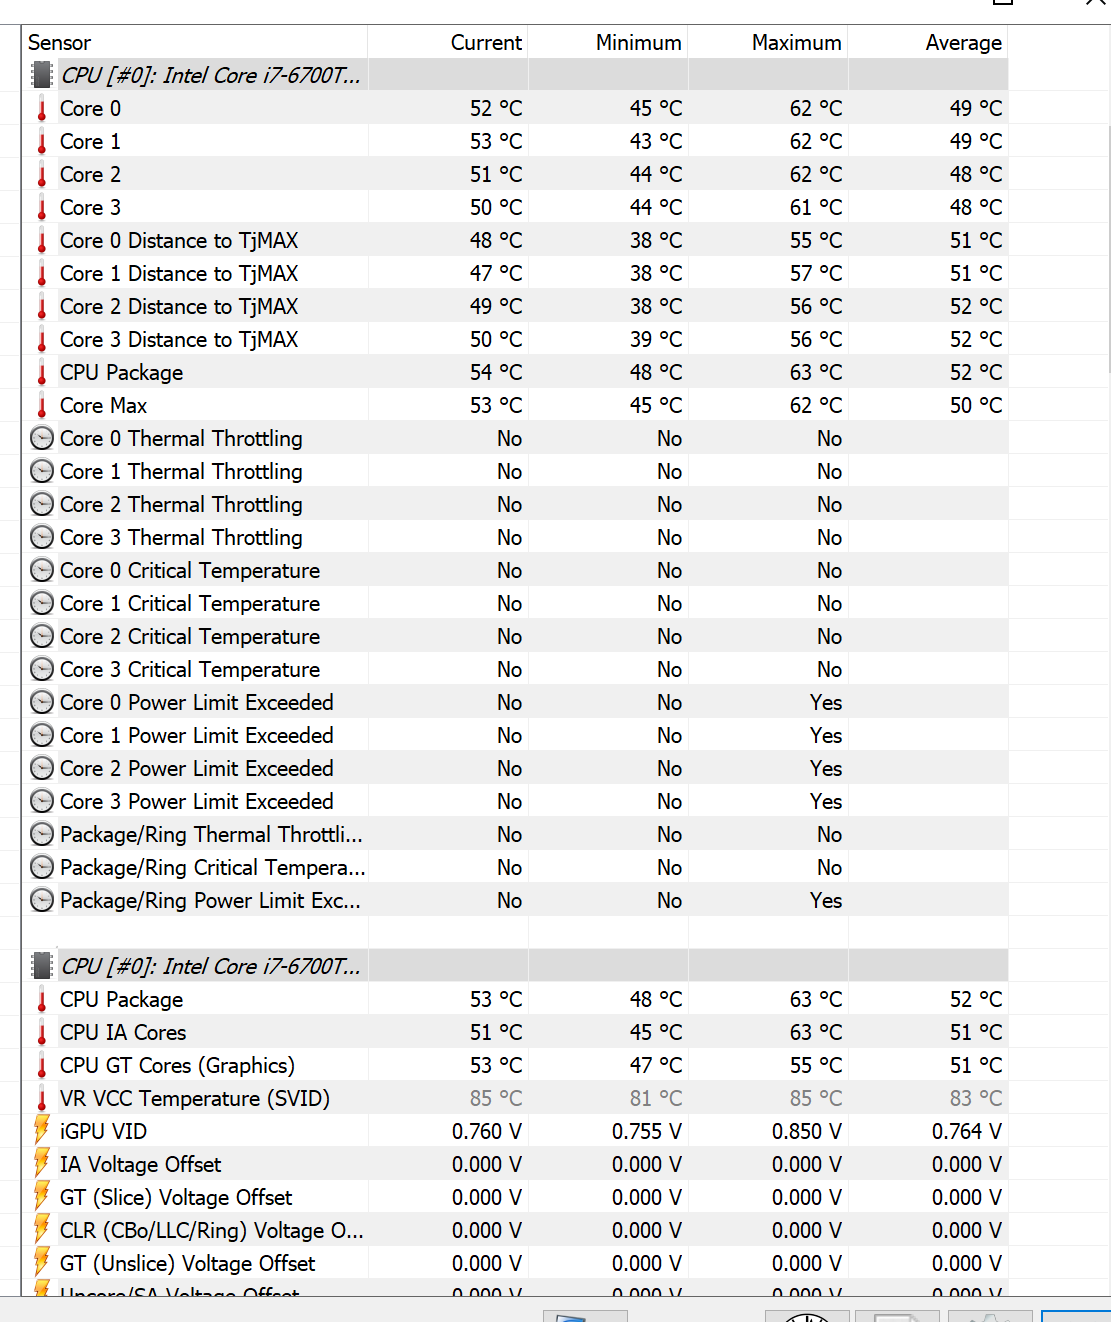
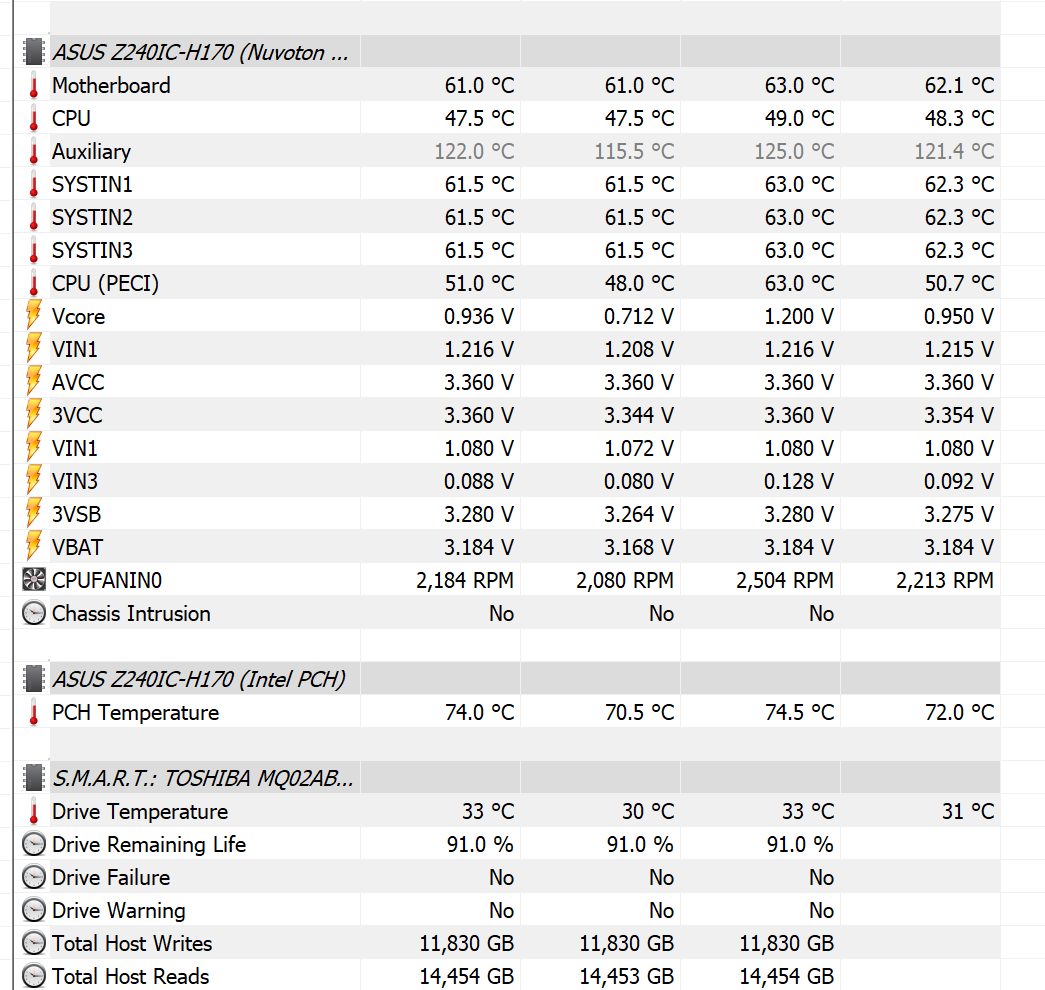
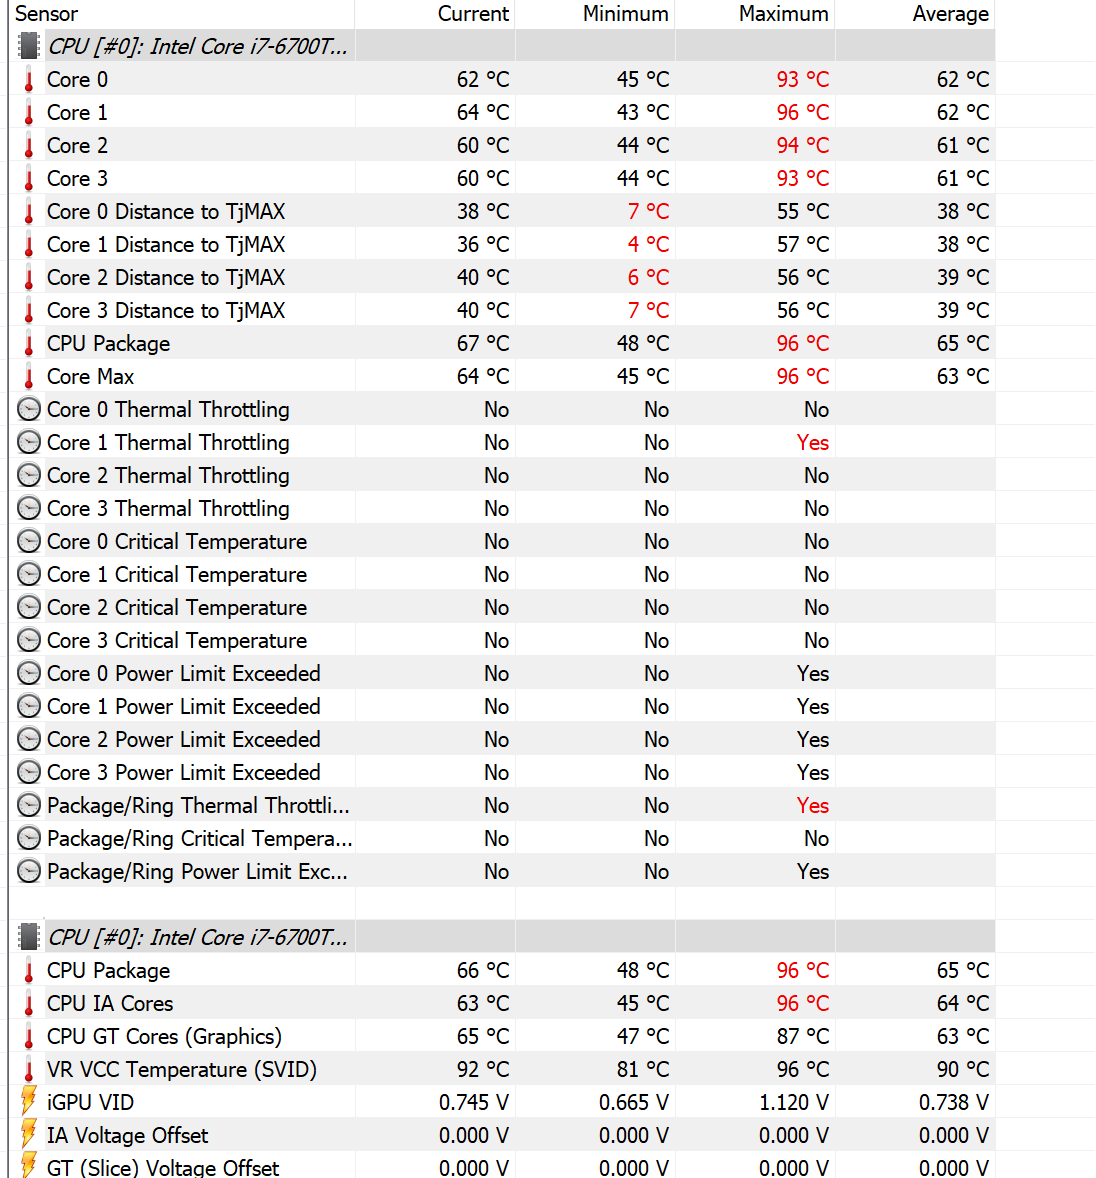
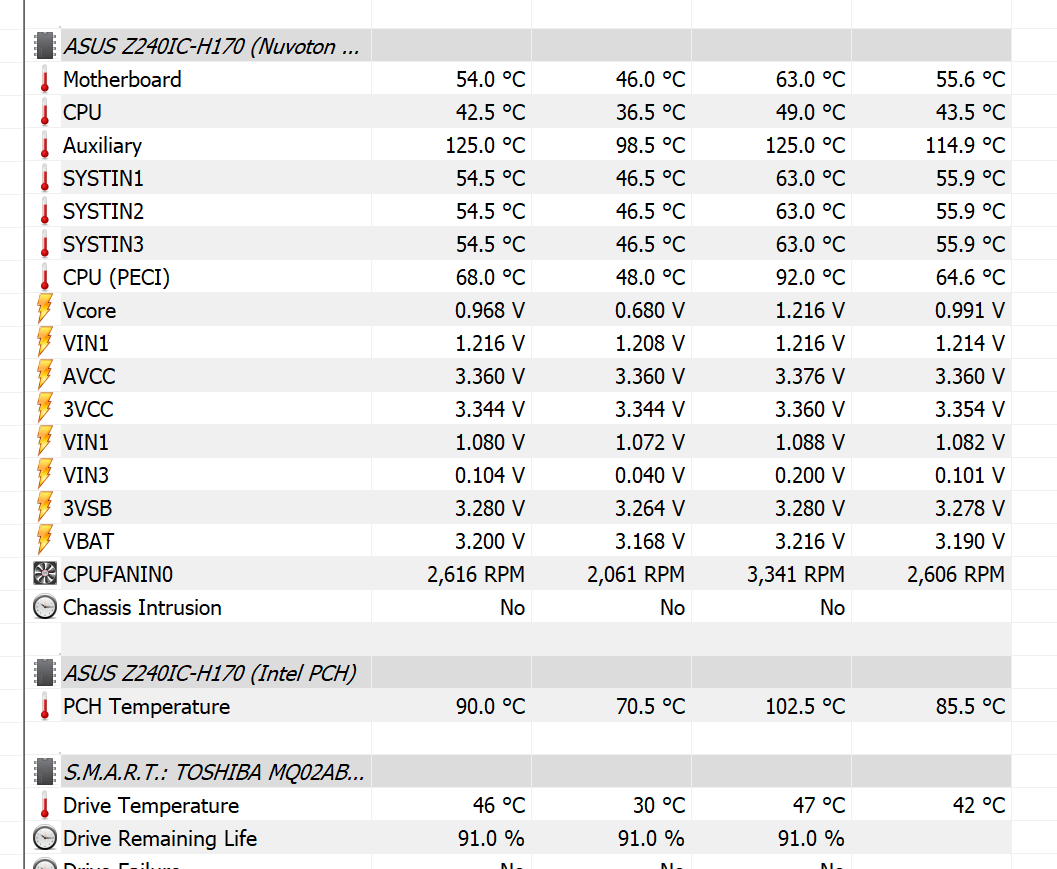
This might be a case of memory corruption. This may be because of a hardware issue such as faulty RAM, overheating (thermal issue) or because of a buggy driver.
A third party driver was identified as the probable root cause of this system error.
Google query: unknown_module_0000000000010000.sys KMODE_EXCEPTION_NOT_HANDLED
On Tue 21-1-2020 21:54:56 your computer crashed or a problem was reported
crash dump file: C:\WINDOWS\Minidump\012120-30906-01.dmp
This was probably caused by the following module: afd.sys (0xFFFFF8047F9687A6)
Bugcheck code: 0x1E (0xFFFFFFFFC0000005, 0xFFFFF8047F9687A6, 0x0, 0xFFFFFFFFFFFFFFFF)
Error: KMODE_EXCEPTION_NOT_HANDLED
file path: C:\WINDOWS\system32\drivers\afd.sys
product: Microsoft® Windows® Operating System
company: Microsoft Corporation
description: Ancillary Function Driver for WinSock
Bug check description: This indicates that a kernel-mode program generated an exception which the error handler did not catch.
This might be a case of memory corruption. This may be because of a hardware issue such as faulty RAM, overheating (thermal issue) or because of a buggy driver.
The crash took place in a Microsoft module. Your system configuration may be incorrect. Possibly this problem is caused by another driver on your system that cannot be identified at this time.
On Mon 13-1-2020 21:24:09 your computer crashed or a problem was reported
crash dump file: C:\WINDOWS\Minidump\011320-29046-01.dmp
This was probably caused by the following module: ntoskrnl.exe (nt+0x1C14E0)
Bugcheck code: 0x1C7 (0x0, 0xFFFFAA0AE17A3000, 0x3185C547, 0x237DA3)
Error: CUSTOM_ERROR
file path: C:\WINDOWS\system32\ntoskrnl.exe
product: Microsoft® Windows® Operating System
company: Microsoft Corporation
description: NT Kernel & System
The crash took place in the Windows kernel. Possibly this problem is caused by another driver that cannot be identified at this time.
On Mon 2-12-2019 22:40:27 your computer crashed or a problem was reported
crash dump file: C:\WINDOWS\Minidump\120219-28140-01.dmp
This was probably caused by the following module: ntoskrnl.exe (nt+0x1C14E0)
Bugcheck code: 0x139 (0x3, 0xFFFFAC814BC5F5A0, 0xFFFFAC814BC5F4F8, 0x0)
Error: KERNEL_SECURITY_CHECK_FAILURE
file path: C:\WINDOWS\system32\ntoskrnl.exe
product: Microsoft® Windows® Operating System
company: Microsoft Corporation
description: NT Kernel & System
Bug check description: The kernel has detected the corruption of a critical data structure.
The crash took place in the Windows kernel. Possibly this problem is caused by another driver that cannot be identified at this time.
On Tue 26-11-2019 15:08:29 your computer crashed or a problem was reported
crash dump file: C:\WINDOWS\Minidump\112619-20375-01.dmp
This was probably caused by the following module: ntoskrnl.exe (nt+0x1C14E0)
Bugcheck code: 0xA (0xFFFFD783DF20E6B8, 0x2, 0x0, 0xFFFFF802662338B3)
Error: IRQL_NOT_LESS_OR_EQUAL
file path: C:\WINDOWS\system32\ntoskrnl.exe
product: Microsoft® Windows® Operating System
company: Microsoft Corporation
description: NT Kernel & System
Bug check description: This indicates that Microsoft Windows or a kernel-mode driver accessed paged memory at DISPATCH_LEVEL or above. This is a software bug.
This bug check belongs to the crash dump test that you have performed with WhoCrashed or other software. It means that a crash dump file was properly written out.
The crash took place in the Windows kernel. Possibly this problem is caused by another driver that cannot be identified at this time.
On Tue 26-11-2019 12:32:37 your computer crashed or a problem was reported
crash dump file: C:\WINDOWS\Minidump\112619-23281-01.dmp
This was probably caused by the following module: ntoskrnl.exe (nt+0x1C14E0)
Bugcheck code: 0x1E (0xFFFFFFFFC0000005, 0xFFFFF8056864AFD3, 0x0, 0xFFFFFFFFFFFFFFFF)
Error: KMODE_EXCEPTION_NOT_HANDLED
file path: C:\WINDOWS\system32\ntoskrnl.exe
product: Microsoft® Windows® Operating System
company: Microsoft Corporation
description: NT Kernel & System
Bug check description: This indicates that a kernel-mode program generated an exception which the error handler did not catch.
This might be a case of memory corruption. This may be because of a hardware issue such as faulty RAM, overheating (thermal issue) or because of a buggy driver.
The crash took place in the Windows kernel. Possibly this problem is caused by another driver that cannot be identified at this time.
On Tue 26-11-2019 12:12:42 your computer crashed or a problem was reported
crash dump file: C:\WINDOWS\Minidump\112619-25828-01.dmp
This was probably caused by the following module: ntoskrnl.exe (nt+0x1C14E0)
Bugcheck code: 0x3B (0xC0000005, 0xFFFFF8073F845D9D, 0xFFFF90877E096A70, 0x0)
Error: SYSTEM_SERVICE_EXCEPTION
file path: C:\WINDOWS\system32\ntoskrnl.exe
product: Microsoft® Windows® Operating System
company: Microsoft Corporation
description: NT Kernel & System
Bug check description: This indicates that an exception happened while executing a routine that transitions from non-privileged code to privileged code.
This appears to be a typical software driver bug and is not likely to be caused by a hardware problem.
The crash took place in the Windows kernel. Possibly this problem is caused by another driver that cannot be identified at this time.
crash dump file: C:\WINDOWS\Minidump\020820-31359-01.dmp
This was probably caused by the following module: ntoskrnl.exe (nt+0x1C14E0)
Bugcheck code: 0x3D (0xFFFFF80167669D28, 0xFFFFF80167669570, 0x0, 0x0)
Error: INTERRUPT_EXCEPTION_NOT_HANDLED
file path: C:\WINDOWS\system32\ntoskrnl.exe
product: Microsoft® Windows® Operating System
company: Microsoft Corporation
description: NT Kernel & System
Bug check description: This bug check appears very infrequently.
The crash took place in the Windows kernel. Possibly this problem is caused by another driver that cannot be identified at this time.
On Sat 8-2-2020 10:33:11 your computer crashed or a problem was reported
crash dump file: C:\WINDOWS\MEMORY.DMP
This was probably caused by the following module: ntkrnlmp.exe (nt!KeSetEventBoostPriority+0x55)
Bugcheck code: 0x3D (0xFFFFF80167669D28, 0xFFFFF80167669570, 0x0, 0x0)
Error: INTERRUPT_EXCEPTION_NOT_HANDLED
Bug check description: This bug check appears very infrequently.
The crash took place in the Windows kernel. Possibly this problem is caused by another driver that cannot be identified at this time.
On Sun 2-2-2020 02:33:27 your computer crashed or a problem was reported
crash dump file: C:\WINDOWS\Minidump\020220-31203-01.dmp
This was probably caused by the following module: unknown_module_0000000000010000.sys (0xFFFFFFFFFFFFFFFF)
Bugcheck code: 0x1E (0xFFFFFFFFC0000005, 0xFFFFF8073D7C82C5, 0x0, 0xFFFFFFFFFFFFFFFF)
Error: KMODE_EXCEPTION_NOT_HANDLED
Bug check description: This indicates that a kernel-mode program generated an exception which the error handler did not catch.
This might be a case of memory corruption. This may be because of a hardware issue such as faulty RAM, overheating (thermal issue) or because of a buggy driver.
A third party driver was identified as the probable root cause of this system error.
Google query: unknown_module_0000000000010000.sys KMODE_EXCEPTION_NOT_HANDLED
On Tue 21-1-2020 21:54:56 your computer crashed or a problem was reported
crash dump file: C:\WINDOWS\Minidump\012120-30906-01.dmp
This was probably caused by the following module: afd.sys (0xFFFFF8047F9687A6)
Bugcheck code: 0x1E (0xFFFFFFFFC0000005, 0xFFFFF8047F9687A6, 0x0, 0xFFFFFFFFFFFFFFFF)
Error: KMODE_EXCEPTION_NOT_HANDLED
file path: C:\WINDOWS\system32\drivers\afd.sys
product: Microsoft® Windows® Operating System
company: Microsoft Corporation
description: Ancillary Function Driver for WinSock
Bug check description: This indicates that a kernel-mode program generated an exception which the error handler did not catch.
This might be a case of memory corruption. This may be because of a hardware issue such as faulty RAM, overheating (thermal issue) or because of a buggy driver.
The crash took place in a Microsoft module. Your system configuration may be incorrect. Possibly this problem is caused by another driver on your system that cannot be identified at this time.
On Mon 13-1-2020 21:24:09 your computer crashed or a problem was reported
crash dump file: C:\WINDOWS\Minidump\011320-29046-01.dmp
This was probably caused by the following module: ntoskrnl.exe (nt+0x1C14E0)
Bugcheck code: 0x1C7 (0x0, 0xFFFFAA0AE17A3000, 0x3185C547, 0x237DA3)
Error: CUSTOM_ERROR
file path: C:\WINDOWS\system32\ntoskrnl.exe
product: Microsoft® Windows® Operating System
company: Microsoft Corporation
description: NT Kernel & System
The crash took place in the Windows kernel. Possibly this problem is caused by another driver that cannot be identified at this time.
On Mon 2-12-2019 22:40:27 your computer crashed or a problem was reported
crash dump file: C:\WINDOWS\Minidump\120219-28140-01.dmp
This was probably caused by the following module: ntoskrnl.exe (nt+0x1C14E0)
Bugcheck code: 0x139 (0x3, 0xFFFFAC814BC5F5A0, 0xFFFFAC814BC5F4F8, 0x0)
Error: KERNEL_SECURITY_CHECK_FAILURE
file path: C:\WINDOWS\system32\ntoskrnl.exe
product: Microsoft® Windows® Operating System
company: Microsoft Corporation
description: NT Kernel & System
Bug check description: The kernel has detected the corruption of a critical data structure.
The crash took place in the Windows kernel. Possibly this problem is caused by another driver that cannot be identified at this time.
On Tue 26-11-2019 15:08:29 your computer crashed or a problem was reported
crash dump file: C:\WINDOWS\Minidump\112619-20375-01.dmp
This was probably caused by the following module: ntoskrnl.exe (nt+0x1C14E0)
Bugcheck code: 0xA (0xFFFFD783DF20E6B8, 0x2, 0x0, 0xFFFFF802662338B3)
Error: IRQL_NOT_LESS_OR_EQUAL
file path: C:\WINDOWS\system32\ntoskrnl.exe
product: Microsoft® Windows® Operating System
company: Microsoft Corporation
description: NT Kernel & System
Bug check description: This indicates that Microsoft Windows or a kernel-mode driver accessed paged memory at DISPATCH_LEVEL or above. This is a software bug.
This bug check belongs to the crash dump test that you have performed with WhoCrashed or other software. It means that a crash dump file was properly written out.
The crash took place in the Windows kernel. Possibly this problem is caused by another driver that cannot be identified at this time.
On Tue 26-11-2019 12:32:37 your computer crashed or a problem was reported
crash dump file: C:\WINDOWS\Minidump\112619-23281-01.dmp
This was probably caused by the following module: ntoskrnl.exe (nt+0x1C14E0)
Bugcheck code: 0x1E (0xFFFFFFFFC0000005, 0xFFFFF8056864AFD3, 0x0, 0xFFFFFFFFFFFFFFFF)
Error: KMODE_EXCEPTION_NOT_HANDLED
file path: C:\WINDOWS\system32\ntoskrnl.exe
product: Microsoft® Windows® Operating System
company: Microsoft Corporation
description: NT Kernel & System
Bug check description: This indicates that a kernel-mode program generated an exception which the error handler did not catch.
This might be a case of memory corruption. This may be because of a hardware issue such as faulty RAM, overheating (thermal issue) or because of a buggy driver.
The crash took place in the Windows kernel. Possibly this problem is caused by another driver that cannot be identified at this time.
On Tue 26-11-2019 12:12:42 your computer crashed or a problem was reported
crash dump file: C:\WINDOWS\Minidump\112619-25828-01.dmp
This was probably caused by the following module: ntoskrnl.exe (nt+0x1C14E0)
Bugcheck code: 0x3B (0xC0000005, 0xFFFFF8073F845D9D, 0xFFFF90877E096A70, 0x0)
Error: SYSTEM_SERVICE_EXCEPTION
file path: C:\WINDOWS\system32\ntoskrnl.exe
product: Microsoft® Windows® Operating System
company: Microsoft Corporation
description: NT Kernel & System
Bug check description: This indicates that an exception happened while executing a routine that transitions from non-privileged code to privileged code.
This appears to be a typical software driver bug and is not likely to be caused by a hardware problem.
The crash took place in the Windows kernel. Possibly this problem is caused by another driver that cannot be identified at this time.
Dumpfiles:
dumpfiles on filebin
My thanks in advance for the help, I hope we can solve it fast.
Kind regards
-Maarten
Last edited: