Jun 28, 2019
2
0
10
Hi i am far from being an expert in hardware stuff, hence i am seeking for advice or confirmation...

Recently, my old computer has started to crash randomly, at first i though it was dust stuck inside the computer, but even after the nice cleanup, it is still crashing. After browsing tom's hardware and more googling, i am pretty sure the issue is my power supply.

Crashes are random, but they seems to be alot more common when playing a game on one screen and having netflix or youtube on the other.

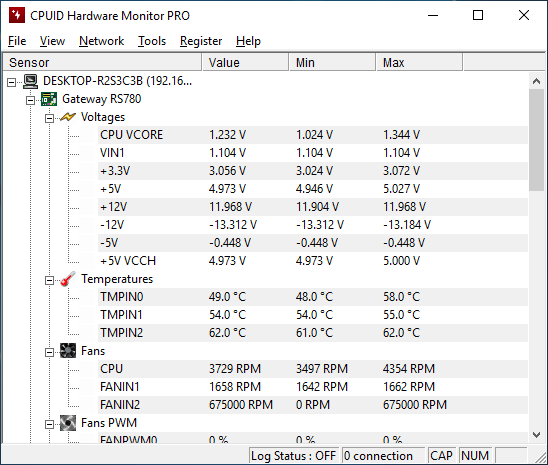
First, the +3.3v seems low from what i have red from the wiki page on ATX psu. But more weird, is the -5v rail. I am kinda wondering if i can trust this tool to report the right values?

On a side note, when looking at the fans inside my computer, they all seems to run fine, what can cause that strange over9000 RPM on FANIN2?

PS: Yes, i am planning on changing my computer soon, but if i can fix it for 50$ and wait for nextgen after summer that would be the ideal for me.

Thanks!!

jHXaJt.jpg
 
Yeah, I don't trust it either. Try HWinfo, which is a lot more reliable. Also, we need to see the PSU sensor values for the system voltages, just as you have shown there but in HWinfo (Sensors only), with it under a load. Running Furmark or Realbench or Prime95 Small FFT are all good ways to put the system under a load for this purpose.

Monitoring software

HWmonitor, Open hardware monitor, Realtemp, Speccy, Speedfan, Windows utilities, CPU-Z, NZXT CAM and most of the bundled motherboard utilities are often not the best choice as they are not always accurate. Some are actually grossly inaccurate, especially with certain chipsets or specific sensors that for whatever reason they tend to not like or work well with. I've found HWinfo or CoreTemp to be the MOST accurate with the broadest range of chipsets and sensors. They are also almost religiously kept up to date.

CoreTemp is great for just CPU thermals including core temps or distance to TJmax on older AMD platforms.

HWinfo is great for pretty much EVERYTHING, including CPU thermals, core loads, core temps, package temps, GPU sensors, HDD and SSD sensors, motherboard chipset and VRM sensor, all of it. When starting HWinfo after installation, always check the box next to "sensors only" and de-select the box next to "summary".


Run HWinfo and look at system voltages and other sensor readings.

Monitoring temperatures, core speeds, voltages, clock ratios and other reported sensor data can often help to pick out an issue right off the bat. HWinfo is a good way to get that data and in my experience tends to be more accurate than some of the other utilities available. CPU-Z, GPU-Z and Core Temp all have their uses but HWinfo tends to have it all laid out in a more convenient fashion so you can usually see what one sensor is reporting while looking at another instead of having to flip through various tabs that have specific groupings, plus, it is extremely rare for HWinfo to not report the correct sensor values under the correct sensor listings, or misreport other information. Utilities like HWmonitor, Openhardware monitor and Speccy, tend to COMMONLY misreport sensor data, or not report it at all.

After installation, run the utility and when asked, choose "sensors only". The other window options have some use but in most cases everything you need will be located in the sensors window. If you're taking screenshots to post for troubleshooting, it will most likely require taking three screenshots and scrolling down the sensors window between screenshots in order to capture them all.

It is most helpful if you can take a series of HWinfo screenshots at idle, after a cold boot to the desktop. Open HWinfo and wait for all of the Windows startup processes to complete. Usually about four or five minutes should be plenty. Take screenshots of all the HWinfo sensors.

Next, run something demanding like Prime95 version 26.6 or Heaven benchmark. Take another set of screenshots while either of those is running so we can see what the hardware is doing while under a load.


*Download HWinfo


For temperature monitoring only, I feel Core Temp is the most accurate and also offers a quick visual reference for core speed, load and CPU voltage:


*Download Core Temp


Posting screenshots, when requested, is helpful so WE can see what is going on as well and you can learn how to do that here:

How to post images on Tom's hardware forums
 
Jun 28, 2019
2
0
10
Well, you were right, HWiNFO64 seems better! Following your advice, i started doing stress tests.

First, using Prime95 Small FFT, left it running for 30min or so, it pushed all my CPU to 100% and the maximum CPU temperature was 61c. Everything else looked normal, apart from the weird value for a fan (either case or psu - same as before over9000!).

Thinking that the power load was not the issues, i felt confident, i started running Furmark while Prime95 was still running. I ran it a few times. My only observation was my furmark score going down with each run. Looking at the GPU sensors, i saw something i thought was unusual. I saw the VRM temperature starting to climb in the upper 90c, however it never hit 100c. Then, all of a sudden my computer crashed/black screen. Rebooted my computer, started executing only GPU tests. Let it ran for 10-15 min or so, saw the VRM was still in the upper 90c but it never crashed.

But theses number were still bugging me. I decided to go all in and bring in the big boy, my portable air conditioner unit! Hook it up in front of the computer, turned it on, sets it to 18c (coolest it will go) and started to run more load tests. Everything was holding up, Prime95 with Furmark. Tried Eve Online with max graphics while watching youtube at 1080p, which i would never normally dare trying knowing it will be crashing within minutes. Tried EveOnline with Prime95 and Furmark running for 10min, that pushed my VRM temperature to 60c or so, but was still holding. I will keep trying to push it and see if i can make it crash, but after an hour or two, it has not.

Now, i am a bit puzzled about what the exact problem is, overheating yes, but what? From what i read online, VRM chips are rated for 100-125c. I also notice the "faulty" fan sensor is now reporting value that seems legit, from 500 to 3500 rpm. Theses VRM are on the graphic graphics and the fan stuff sits on the motherboard! Maybe an OLD computer is more sensible to temperature? Might it be the motherboard overheating? It is the only common piece... On the other hand, having my portable air conditioner hooked on my computer is not an "ideal" solution! LOL! But it kinda seems to be fixing my issues...

Any more advice on what could be the exact issue? Maybe some more specific tests? Any input is appreciated!
 
Last edited:
Usually this results, the fan thing, from running a fan on the wrong kind of header. I'd look at the end of the fan cables for each fan where they plug in at and see if they are 3 pin or 4 pin, and whether the header they are plugged into are the same number of pins or different. A 3 pin fan plugged into a four pin header will run, but will usually run at full speed unless you have a board that can do switch between DC and PWM on the same header. Most newer boards have provisions for doing this while most older boards do not.

I'm actually seeing 675000rpm on your screenshot. Knowing a little more about your fan models (Should be right on the fans themselves, on the stickers attached to the backside of the fan motor), and the rest of your hardware specs like motherboard model would be necessary to help further but suffice to say that's obviously an erroneous reading and could be because of what it's connected to, or the fan itself, or a problem with the fan controller on the motherboard.