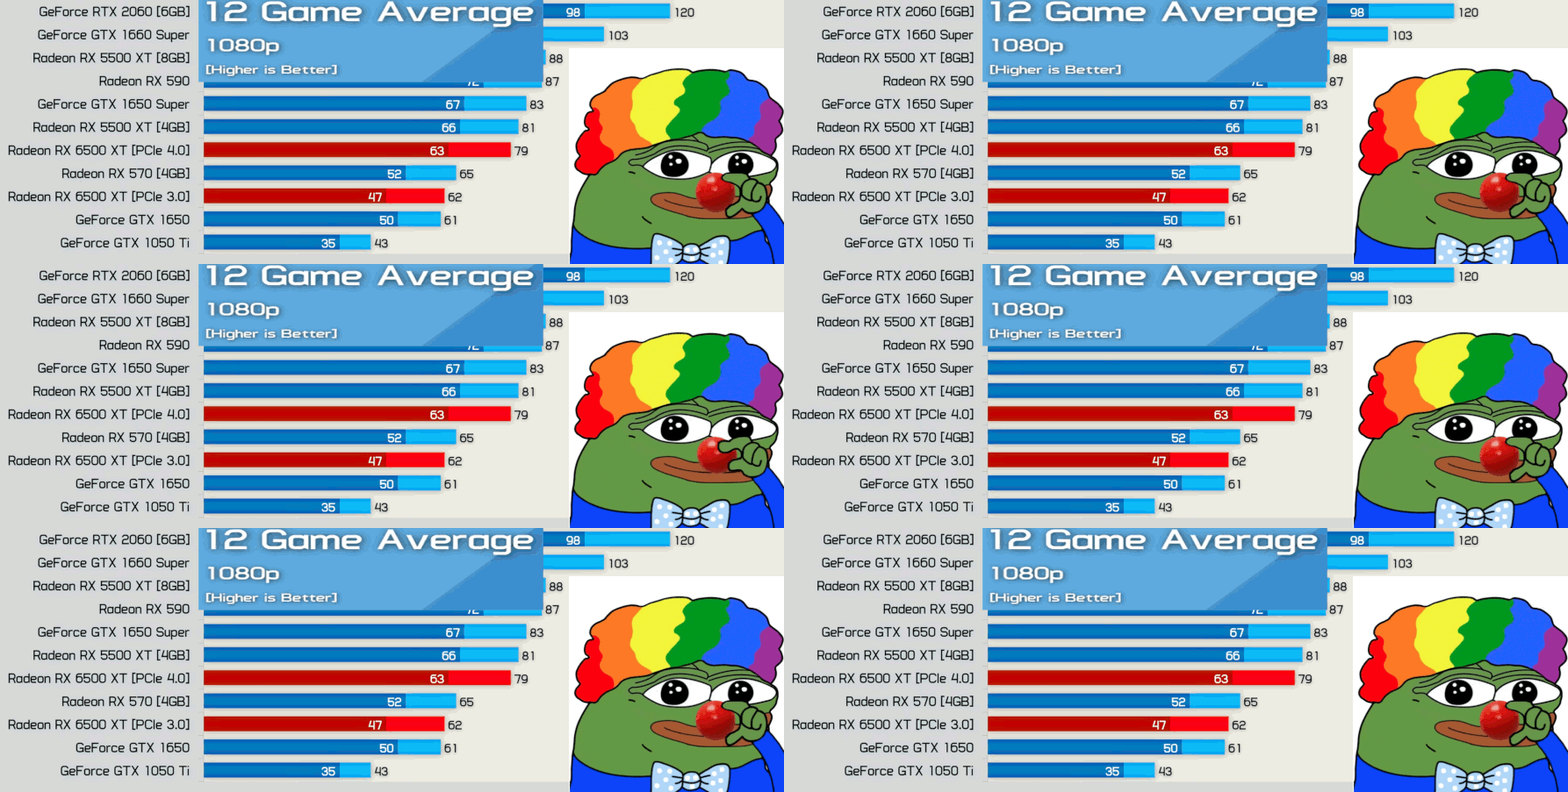
If repeatability is so problematic on 4GB cards overall, it may be a sign that graphs need to get variance bars to represent how (un)repeatable results are.
Usually it's only a problem if you change settings and don't exit and restart the game (in a game that lets you do that). I've done lots of testing over the years, and generally speaking cards with 8GB and more VRAM can go from 1080p to 1440p to 4K in testing without exiting and restarting. With a 4GB card, you sometimes end up in a severely degraded performance state and need to exit and relaunch. But with low-level DX12/Vulkan APIs, sometimes it's just a periodic glitch that causes performance to suffer. I've seen issues with 4GB and even 6GB cards in
Watch Dogs Legion at times. Usually, exiting and restarting the game will clear the problem.
Far Cry 6 was unusual in that it had high run to run variance seemingly whenever it exceeded the card's VRAM. The game also showed changes in the amount of VRAM it thought it needed, which was certainly odd.
Anyway, the problem with charts is that there are lots of people who can only really manage to grok relatively simple bar charts. Start adding variance and all that other stuff and only stock investors and traders, and stats majors, are likely to get what we're showing. Plus, how many runs should I do for each setting? I try to stay with three, but do more if there's clear variance happening, and sometimes a lot more if I'm just unable to figure out what's happening (e.g. with
FC6). If I had to do 10 runs of each setting, then run the results through some stats to get variance bars and such, it would dramatically decrease my throughput and workflow, and likely the potential gains (people understanding a bit better what's happening) would not even be there.
Fundamentally, I want to provide a relatively "modern" look at how graphics cards perform in a variety of situations. I have a couple of very recent games in my updated test suite, along with some slightly older games that are still useful (and relatively easy to use). I don't want to show a bunch of games that specifically
won't tax 4GB cards, but neither do I only want to look at games that basically require 8GB or more. And then when I create the aggregate scores for the GPU hierarchy, I definitely don't want a bunch of random "bad" results that penalize slower GPUs. So, I figure most people will use settings that run at closer to acceptable levels of performance, and running a few extra tests to see where the high water mark is helps keep the charts more sensible. For people who care, there's the text that will call out anomalies. 🙃
As an aside,
RDR2 strictly prevents you from selecting settings that exceed a card's VRAM, but you can edit the config file to try and get around that. I was able to force 1080p "ultra" and 1440p "ultra" to run, though 1440p resulted in periodic graphical corruption. 4K ultra is too much, however, and just crashes to desktop. Anyway, I need some meaningful number to avoid skewing the overall results — not having a low score present can increase the calculated average, but putting in a "0" result can go too far the other direction.


