Full hardware specifications including CPU, motherboard, FULL amount of memory and memory kit model, CPU cooler, power supply model, case, number of case fans, case fan orientation for EACH case fan location, etc?
Also, please expand the list of task manager processes and take another screenshot of those AND please ditch HWmonitor. Get HWinfo, it will make life at least a little easier and a little more accurate.
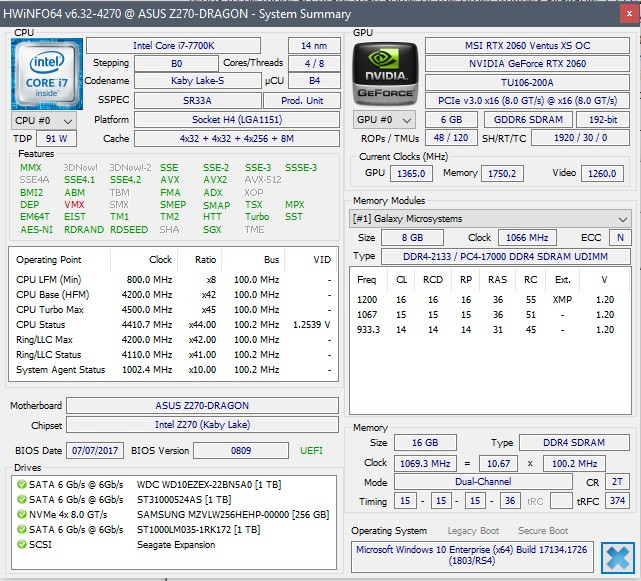
Monitoring software
HWmonitor, Open hardware monitor, Realtemp, Speccy, Speedfan, Windows utilities, CPU-Z, NZXT CAM and most of the bundled motherboard utilities are often not the best choice as they are not always accurate. Some are actually grossly inaccurate, especially with certain chipsets or specific sensors that for whatever reason they tend to not like or work well with. I've found HWinfo or CoreTemp to be the MOST accurate with the broadest range of chipsets and sensors. They are also almost religiously kept up to date.
CoreTemp is great for just CPU thermals including core temps or distance to TJmax on older AMD platforms.
HWinfo is great for pretty much EVERYTHING, including CPU thermals, core loads, core temps, package temps, GPU sensors, HDD and SSD sensors, motherboard chipset and VRM sensor, all of it. When starting HWinfo after installation, always check the box next to "sensors only" and de-select the box next to "summary".
Run HWinfo and look at system voltages and other sensor readings.
Monitoring temperatures, core speeds, voltages, clock ratios and other reported sensor data can often help to pick out an issue right off the bat. HWinfo is a good way to get that data and in my experience tends to be more accurate than some of the other utilities available. CPU-Z, GPU-Z and Core Temp all have their uses but HWinfo tends to have it all laid out in a more convenient fashion so you can usually see what one sensor is reporting while looking at another instead of having to flip through various tabs that have specific groupings, plus, it is extremely rare for HWinfo to not report the correct sensor values under the correct sensor listings, or misreport other information. Utilities like HWmonitor, Openhardware monitor and Speccy, tend to COMMONLY misreport sensor data, or not report it at all.
After installation, run the utility and when asked, choose "sensors only". The other window options have some use but in most cases everything you need will be located in the sensors window. If you're taking screenshots to post for troubleshooting, it will most likely require taking three screenshots and scrolling down the sensors window between screenshots in order to capture them all.
It is most helpful if you can take a series of HWinfo screenshots at idle, after a cold boot to the desktop. Open HWinfo and wait for all of the Windows startup processes to complete. Usually about four or five minutes should be plenty. Take screenshots of all the HWinfo sensors.
Next, run something demanding like Prime95 (With AVX and AVX2 disabled) or Heaven benchmark. Take another set of screenshots while either of those is running so we can see what the hardware is doing while under a load.