Question What exactly controls how much of the GPU is used for certain programs?

atticus_maytrap

Reputable
Nov 12, 2018
74
3
4,545
Hi there, note: i have posted about this before, but im looking for a more fine tuned answer, please bear with me here

my question is in regard to a curious problem ive been having for the better part of a year now with my 1080Ti and my work programs - namely Autodesk products, Revit, Autocad, Naviswork etc (but not limited to).

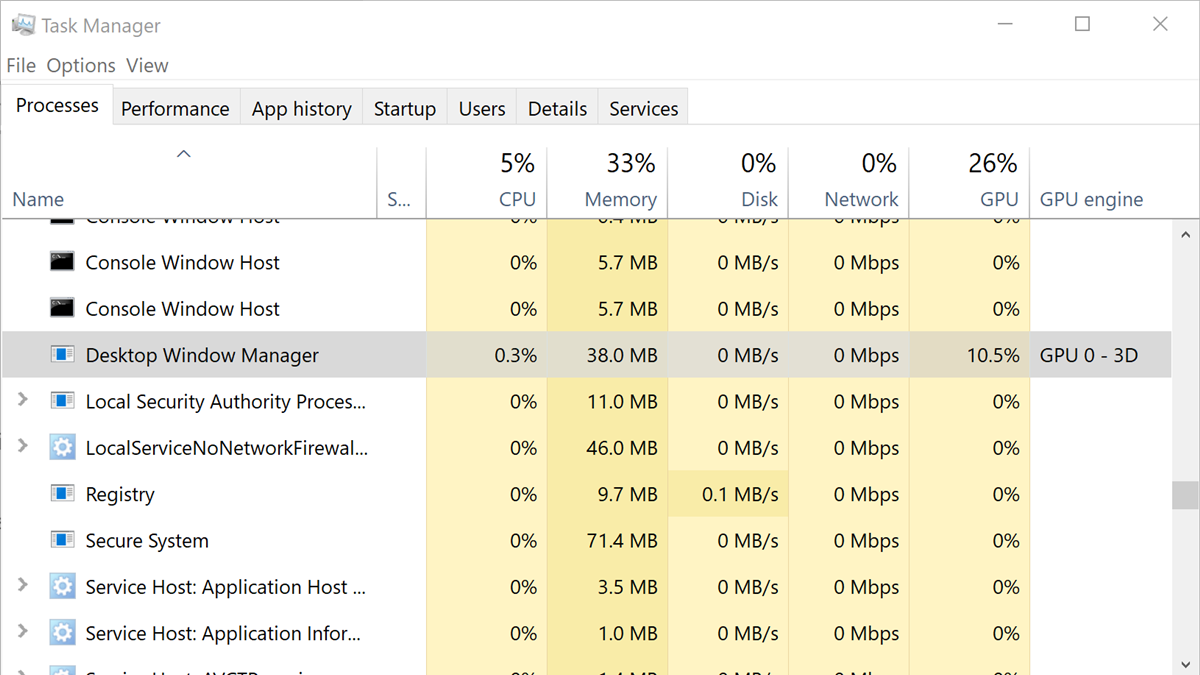
Basically, in about July / August of last year i noticed in Afterburner that the GPU clock was ramping up to load levels (1900Mhz +) when using the above programs, and the usage spiking up past 60-70%. It never used to do this, in the past for these programs the clock never exceeded base levels and the usage never got past 20-25% with normal usage - navigating around view windows etc.

It does even need to be a complicated model, i can open a completely empty file with no geometry modelled, and just running the mouse through the window will cause the GPU to spike upwards.

This phenomenon also occurs in other non-3D programs. If i detach the Afterburner graphs and then run the mouse over them, this also causes the GPU clock to spike upwards.
Similar thing happens with Adobe products, Premier Pro and Indesigen.

However, in other more intense 3D programs like 3D Studio Max - also an Autodesk product - the clock behaves exactly as expected, never exceeds base and usage never gets past 20%.

At first i was sure this was driver related, as rolling back to an older driver (466.47) got rid of the problem.

I carried on with this for a few months, everything in order, even rolled up a driver a few times towards the end of last year, no change.

I then encountered an issue with some games, massive performance drop across the board. I DDU'd the driver out and rolled back, and BAM, the upclocking bug with regard to my work programs was back. I tired rolling back to my previous "safe" driver 466.47, but this didnt change anything.

I carried on with the bug a for a time, it wasnt causing any dangerous temp changes and everything still worked as it should, and after a time it seemingly went away by itself without any updates or input from me.

It was a 3 week or more period with the clock behaving exactly as it should. Now, it has resurfaced again - and the only thing i did before it came back was open the Geforce Experience App on my machine - not to update, just to see the optmisation of some games.

Up until last week it was more or less a coin toss everytime i turned the machine on - will the the upclocking bug be there or not? Sometimes it would be gone, but would then come back after waking the machine up from sleep mode.

For the past week and a half it has been permanently there though, and nothing seems to be change it.

My question is simple: What actually determines the GPU clock and usage with regard to certain programs?
Is it purely based on the driver, or is there a windows element at play here?


Windows 10 21H1
1080Ti
19-9900k
32GB RAM
850W Be Queit! Gold Straight power PSU
Z390 Rog Strix
 

Colif

Win 11 Master
Moderator
I believe Windows Desktop Manager plays a part but finding specifics is difficult
Instead of applications drawing their displays directly to your screen, applications write the picture of their window to a specific place in memory. Windows then creates one “composite” view of all the windows on the screen before sending it to your monitor. Because Windows is compositing and displaying the contents of each window, it can add effects like transparency and window animations when layering the windows for display.

it sits between applications and the GPU drivers.

its not the drivers as they wouldn't know when to run fast/slow without OS telling them.
 
Last edited:
  • Like
Reactions: atticus_maytrap

Colif

Win 11 Master
Moderator
I don't know if applications themselves don't have directx commands to enable some things


its definitely windows that tells GPU drivers what to do
The graphics processor that the Windows 10 OS selects overrides any settings made in the NVIDIA Control Panel > Manage 3D Settings > Global Settings | Program Settings >Preferred graphics processor setting for that application. If the OS does not specify a graphic processor preference for a given application, then users can specify the preferred graphics processor to use from the NVIDIA Control Panel > Manage 3D Settings > Global Settings | Program Settings > Preferred graphics processor setting.
https://nvidia.custhelp.com/app/ans...ssing-from-context-menu:-change-in-process-of

but not sure exactly what part.
 
  • Like
Reactions: atticus_maytrap

atticus_maytrap

Reputable
Nov 12, 2018
74
3
4,545
I don't know if applications themselves don't have directx commands to enable some things


its definitely windows that tells GPU drivers what to do

https://nvidia.custhelp.com/app/answers/detail/a_id/5035/~/run-with-graphics-processor-missing-from-context-menu:-change-in-process-of

but not sure exactly what part.
hey man, thanks so much for replying.

its definitely making more and more sense that windows is somehow at play here, the random there/not there nature of the bug certainly implies it

i did notice that for the periods it was absent, the GPU was using a lot less resources for certain games. Eg, when the bug wasnt present 3 weeks ago, playing BF 2042 only used around 60-70% of the card. Now that its back, the card is using 97%+ when playing the same game.

as i said in the OP, the only thing i did differently between the bug between absent and there again was open the Geforce Experience App.
I didnt update anything, i only opened it to see the optimsation status of my games. For the period the upclocking bug was absent and my games performance was below average, none of the games were being shown as "optimised" in the list - "information could not be retrieved".
This time when i opened it, my screens went momentarily black, everything came back, and then all the games in the list were being shown as optimised again.
I went for a lunch break, put the machine into sleep mode, came back to it and BAM, upclocking bug was back, the first time in over 3 weeks.

I restarted the machine and it was gone again. Now, its there permanently.

both Autocad and Revit have an internal option for enabling Hardware Acceleration, however i have always had this turned on since installing both programs in early 2020 - its on by default - and the bug came along only last year.

I have tried turning the Hardware Acceleration option off in both programs when the bug is present, and it makes no difference, clock still shoots up to load levels in the most basic bitch circumstances.

When i've turned HA off and the bug is NOT present (everything working normally), the difference is very noticeable - incredibly slow performance in the program view, GPU only using around 5-10%, as to be expected.

Further to this, this upclocking bug only seems to occur on my home machine. My office machine has the exact same programs installed, and there the GPU functions as expected - also using a 1080, not a Ti though.
 

Colif

Win 11 Master
Moderator
I assume its not this - https://helpx.adobe.com/au/premiere-elements/using/gpu-acceleration.html

in the nvidia control panel, in Manage 3d settings, what is Power management mode set to? i think default is optimum power, i changed mine to Prefer maximum Performance (but for a different latency related reason). Not sure it help

you can override Applications using the Manage 3d settings/Program settings but clearly windows is running those apps faster for some reason.
 
  • Like
Reactions: atticus_maytrap

atticus_maytrap

Reputable
Nov 12, 2018
74
3
4,545
i also have power management set to prefer max performance, but i have changed this setting back to optimal and it makes no difference

just for the info, i did have it (power management) set to optimal for the longest time, but i started getting TDR errors early last year.
Everytime the GPU would clock down from base or load levels - post gaming, switching off my extra monitors - system would freeze and restart, whocrashed saying it was a TDR error.
Prefer max performance keeps the card at base levels, no more TDR errors.

During my recent periods of normal GPU behaviour, the PM was still set to PMP
 
Also windows graphics settings can determine if something will run in hig or low power mode.
graphics-performance.png
 
  • Like
Reactions: atticus_maytrap
My question is simple: What actually determines the GPU clock and usage with regard to certain programs?
Is it purely based on the driver, or is there a windows element at play here?
It's a mixture of both. Here's a block diagram of the display driver architecture (from https://docs.microsoft.com/en-us/wi...a-and-later-display-driver-model-architecture)

dx10arch.png


The application submits work to one of the runtimes, which ultimately has to go through the kernel level subsystem. The subsystem will determine how the work gets scheduled, such as if you're running two 3D applications at the same time, the one you're actually using will get priority over the other. The drivers may likely determine which power state the video card should be in based on the workload it received, unless you told it to maintain a high power profile at all times or did something like lock the V-F curve.

However, before any of that gets done, the application has to be in a position to actually submit work for the GPU to do, and this requires the CPU to do something as well. For example in games, all of the in game logic and whatnot has to be processed before graphics are considered.
 
Last edited:

Colif

Win 11 Master
Moderator
that is a handy chart, I see those file names all the time, nice to see how its all linked up.
I should copy that link. explains why i see win32k.sys in bsod errors.
I was looking at gdi before but I couldn't see the full picture.

I wonder what user mode display driver is, its not the GPU drivers as they run in kernel mode
Graphics hardware vendors must write user-mode display drivers for their display adapters. The user-mode display driver is a dynamic-link library (DLL) that is loaded by the Microsoft Direct3D runtime. A user-mode display driver must at least support the Direct3D version 9 DDI.
link
guess its part of the install package
 
that is a handy chart, I see those file names all the time, nice to see how its all linked up.
I should copy that link. explains why i see win32k.sys in bsod errors.
I was looking at gdi before but I couldn't see the full picture.

I wonder what user mode display driver is, its not the GPU drivers as they run in kernel mode

link
guess its part of the install package
According to https://aviadshamriz.medium.com/part-2-display-miniport-hooking-e1a54661d2e1 , the manufacturers are responsible for developing the so-called display miniport driver. Though I suspect from https://docs.microsoft.com/en-us/wi...and-later-display-driver-model-operation-flow , all the display miniport driver is doing is providing a means of how to actually send data to the hardware. The data itself (e.g., translating shaders into commands) gets generated in user mode.
 

atticus_maytrap

Reputable
Nov 12, 2018
74
3
4,545
It's a mixture of both. Here's a block diagram of the display driver architecture (from https://docs.microsoft.com/en-us/wi...a-and-later-display-driver-model-architecture)

dx10arch.png


The application submits work to one of the runtimes, which ultimately has to go through the kernel level subsystem. The subsystem will determine how the work gets scheduled, such as if you're running two 3D applications at the same time, the one you're actually using will get priority over the other. The drivers may likely determine which power state the video card should be in based on the workload it received, unless you told it to maintain a high power profile at all times or did something like lock the V-F curve.

However, before any of that gets done, the application has to be in a position to actually submit work for the GPU to do, and this requires the CPU to do something as well. For example in games, all of the in game logic and whatnot has to be processed before graphics are considered.
Hey man, thanks for replying, that is indeed a handy chart

looking at it though, im still left wondering why this bug affects some programs and not others

If it was ALL of my 3D works apps, i would think nothing of it, it would make sense - but its only SOME of them, and not even the most 3D intense ones.

And also, when the bug is present, it extends to other completely non-3D programs, like the reaction i get from running the mouse over the Afterburner graphs
 

atticus_maytrap

Reputable
Nov 12, 2018
74
3
4,545
According to https://aviadshamriz.medium.com/part-2-display-miniport-hooking-e1a54661d2e1 , the manufacturers are responsible for developing the so-called display miniport driver. Though I suspect from https://docs.microsoft.com/en-us/wi...and-later-display-driver-model-operation-flow , all the display miniport driver is doing is providing a means of how to actually send data to the hardware. The data itself (e.g., translating shaders into commands) gets generated in user mode.

Just for the info, when i do run the mouse across the Afterburner graph and the GPU usage starts shooting up, the process shown as using the GPU in the Task Manager is the Client-Server Runtime Process

Does this indicate anything important?
 
Just for the info, when i do run the mouse across the Afterburner graph and the GPU usage starts shooting up, the process shown as using the GPU in the Task Manager is the Client-Server Runtime Process

Does this indicate anything important?
When you move the mouse, the computer has to start drawing new frames to show it. If you have a high refresh rate monitor, I'm willing to bet the sudden jump in GPU usage is related to that.

Regarding that process, the interwebs says it used to handle most of the graphics subsystem prior to Windows Vista. Most of that was moved elsewhere but it's still used for "critical tasks", whatever that means.
 
  • Like
Reactions: atticus_maytrap

kanewolf

Titan
Moderator
Hey man, thanks for replying, that is indeed a handy chart

looking at it though, im still left wondering why this bug affects some programs and not others

If it was ALL of my 3D works apps, i would think nothing of it, it would make sense - but its only SOME of them, and not even the most 3D intense ones.

And also, when the bug is present, it extends to other completely non-3D programs, like the reaction i get from running the mouse over the Afterburner graphs
Remember that each block shown on that diagram has dozens (or hundreds) of entry points. "Open GL runtime" is thousands of lines of code with hundreds of entry points. One of those entry points could have a bug. Not all software will use that entry point. Maybe even most WON'T. So the impact on application software can vary.
 
  • Like
Reactions: atticus_maytrap

Colif

Win 11 Master
Moderator
The crss.exe also has the responsibility of launching the conhost.exe whenever it is essential.
nothing special, just command prompt

The client server runtime process is one of the most integral and vital component of your operating system. This process is symbolized by crss.exe in the Windows operating system and it has the responsibility for providing the graphical subsystem which includes managing Windows, drawing things on the screen and other similar functions. The crss.exe also does the shutting down process and console windows.
https://en.inspur.com/en/service_information_servers/2553235/index.html

its the environment which your user runs it. It crashes, windows does too.
 

atticus_maytrap

Reputable
Nov 12, 2018
74
3
4,545
When you move the mouse, the computer has to start drawing new frames to show it. If you have a high refresh rate monitor, I'm willing to bet the sudden jump in GPU usage is related to that.

Regarding that process, the interwebs says it used to handle most of the graphics subsystem prior to Windows Vista. Most of that was moved elsewhere but it's still used for "critical tasks", whatever that means.

i have one 144Mhz monitor, my main one, and i did try playing with the refresh rate of that one to see if it made a difference but it didnt

even then, if that were the culprit here, wouldnt i be seeing high GPU usage permanently and not just in repsonse to certain programs?
 

Colif

Win 11 Master
Moderator
how high is it going?

moving my mouse around just on apps on the desktop shows .1% usage against windows desktop manager on a 144htz monitor so there is an effect when you do it, its just tiny. I get CPU spikes if I move cursor but thats generally from idle and more a feature of Ryzen.

Try a clean boot and see if it changes anything - make sure to read instructions and make sure NOT to disable any Microsoft services or windows won't load right - https://support.microsoft.com/en-au/help/929135/how-to-perform-a-clean-boot-in-windows

if clean boot fixes it, it shows its likely a startup program. You should, over a number of startups. restart the programs you stopped to isolate the one that is to blame.

some suggestions - https://answers.microsoft.com/en-us...s/c623acf8-0515-48d1-9e1f-6734b9699670?page=1
 
  • Like
Reactions: atticus_maytrap

atticus_maytrap

Reputable
Nov 12, 2018
74
3
4,545
how high is it going?

moving my mouse around just on apps on the desktop shows .1% usage against windows desktop manager on a 144htz monitor so there is an effect when you do it, its just tiny. I get CPU spikes if I move cursor but thats generally from idle and more a feature of Ryzen.

Try a clean boot and see if it changes anything - make sure to read instructions and make sure NOT to disable any Microsoft services or windows won't load right - https://support.microsoft.com/en-au/help/929135/how-to-perform-a-clean-boot-in-windows

if clean boot fixes it, it shows its likely a startup program. You should, over a number of startups. restart the programs you stopped to isolate the one that is to blame.

some suggestions - https://answers.microsoft.com/en-us...s/c623acf8-0515-48d1-9e1f-6734b9699670?page=1
i tired exactly this (clean boot) a few months ago when the problem popped up again, sadly it bore no fruit, the bug was just there no matter what

on my home machine the GPU usage when im using Revit can spike up to 70-80% just by panning around a model or selecting geometry
im using it on my office machine right now, and here its not getting past 20%
For other work apps, like Autocad which i never even use as a 3D program, the usage can spike up to 95%+
and again, here on my office machine its only using 15%-20% when navigating around a workspace

with other 3D programs though like 3DS Max, the GPU usage behaves as expected on both machines
 

atticus_maytrap

Reputable
Nov 12, 2018
74
3
4,545
Perhaps it’s the GeForce experience that’s causing it
this was my thought recently, it made the most sense because it was the only program that i had opened that then brought on the bug again after a few weeks of being absent.

But ive been told by all and sundry that Geforce Experience has apparently no influence on the GPU usage with regards to the games and apps it detects.

Even then, i did try uninstalling it and restarting it to see if it made a difference, and sadly it does not
 

atticus_maytrap

Reputable
Nov 12, 2018
74
3
4,545
its not geforce experience if it happens in a clean boot

I can find high CPU usage moving mouse around in Autocad - https://forums.autodesk.com/t5/autocad-forum/high-cpu-usage-when-moving-mouse/td-p/1781373

Looks like its an Nvidia driver problem - https://forums.autodesk.com/t5/revit-architecture-forum/revit-nvidia-drivers/td-p/10605055

the OP from the second link from the Revit forum is actually me, Autodesk was the first place i went to when this problem started since it only seemed to be affecting Autodesk products, but i now know that's not the case
 

Colif

Win 11 Master
Moderator
I hate when people do that... turn out to be the person asking question here :)

damn, its really rare then since... its only you.

The GPU will spike when you are panning and zooming, yes. Thats any software, really. You can get it to do that dragging Folders around, too. lol.

Here is what they had me do:

  1. Open NVIDIA Control Panel --> Manage 3D settings.
  2. Go to Global Settings tab.
  3. In the setting window, change the 'global preset' to '3D visual simulation app'.
  4. Also check below settings too,
• Power management mode – prefer maximum performance
• Ambient Occlusion – Off
• Triple buffering – off
• Threaded optimization – ON
• Vertical Sync – Adaptive
5. Click on Save,.

https://www.revitforum.org/forum/re...ture-and-general-revit-questions/45486-/page2
 
  • Like
Reactions: atticus_maytrap

atticus_maytrap

Reputable
Nov 12, 2018
74
3
4,545
I hate when people do that... turn out to be the person asking question here :)

damn, its really rare then since... its only you.


https://www.revitforum.org/forum/re...ture-and-general-revit-questions/45486-/page2
no worries, had to laugh when i saw my OG thread getting referenced here

yeh it is really strange. Like i said, at first i was sure it was just an Autodesk problem, but ive since then been seeing this abnormal GPU usage in regard to a bunch of other programs.
Adobe products i can understand (maybe) but its the weird outliers like MSI Afterburner and Drivereasy that make it a real head scratcher