Look, your first statement started with what felt like an attack to me: "That's not accurate. You're taking the mean to represent the typical case, but median is actually a better measure of that." That's a description of "intent" if I ever heard one.
No, it's not a statement of intent. If I said you were
trying to bias the results by using the mean to represent the typical case,
that would be a statement of intent. Merely pointing out a discrepancy is not the same as alleging impure motives.
Just so we're clear: I never thought you were intentionally
trying to mislead anyone. However, I do think your methodology is having that effect. I have a lot of respect for you and all the effort and diligence you put into your testing & articles. Further, I appreciate your engagement with us, in the forums.
Like is median actually the best? Obviously I don't think so.
Agreed, it's not the
best. I just wanted to counter your statement with what I believe to be a
better predictor of the
typical case.
There's also no "medianif" function, or a "geomeanif" for that matter, which sort of stinks.
If you need another conditional, perhaps you can make an extra, hidden column?
But it's easy to list potential data sets that will make median look stupid, like this:
Now we're getting into the heart of the issue, which is this: when is mean a particularly poor predictor of the typical case? I contend this is true whenever your distribution is skewed or lopsided. I actually made plots of the power distribution from your data, but I need to find somewhere to host them. Anyway, just by eyeballing the data, you can see the distribution isn't symmetrical.
Outside of 1080p, the results for any of the three options aren't going to differ that much.
Using my criteria of 95% utilization, the games
below that threshold compute as follows:
| Test | Resolution | Avg Clock | Avg Power | Avg Temp | Avg Utilization |
|---|
| 10-game average | 1440p | 2747.8 | 332.5 | 56.2 | 79.8% |
| 5-game average | 4k | 2757.4 | 358.6 | 56.9 | 86.5% |
| Borderlands 3 | 1440p | 2760.0 | 412.5 | 61.5 | 92.7% |
| Far Cry 6 | 1440p | 2760.0 | 232.6 | 51.1 | 65.7% |
| Far Cry 6 | 4k | 2760.0 | 335.1 | 54.2 | 94.4% |
| Flight Simulator | 1440p | 2760.0 | 353.7 | 57.2 | 71.1% |
| Flight Simulator | 4k | 2760.0 | 347.1 | 55.2 | 70.9% |
| Fortnite | 1440p | 2745.0 | 385.4 | 60.9 | 93.8% |
| Forza Horizon 5 | 1440p | 2769.8 | 251.1 | 50.2 | 82.6% |
| Forza Horizon 5 | 4k | 2760.0 | 314.9 | 55.5 | 92.7% |
| Horizon Zero Dawn | 1440p | 2760.6 | 256.7 | 51.9 | 65.7% |
| Horizon Zero Dawn | 4k | 2758.0 | 382.1 | 58.5 | 94.7% |
| Metro Exodus Enhanced | 1440p | 2729.0 | 418.7 | 61.4 | 92.6% |
| Minecraft | 1440p | 2670.0 | 342.8 | 56.8 | 66.4% |
| Minecraft | 4k | 2748.8 | 413.6 | 61.2 | 80.0% |
| Total War Warhammer 3 | 1440p | 2760.0 | 395.9 | 59.8 | 94.4% |
| Watch Dogs Legion | 1440p | 2763.4 | 275.2 | 50.8 | 72.8% |
These numbers,
332.5 and
358.6 Watts, are also somewhat different than your 13-game averages of
345.3 and
399.4 (respectively) and
very different than the > 95% utilization numbers of
422.2 and
428.9 Watts. So, it's really a tale of two usage scenarios: high-utilization and lower-utilization.
Why is one of those more desirable, unless you're trying to make the numbers skew? Which is the problem with so many statistics: they're chosen to create a narrative.
As I said before, when the situation is complex, a single number is going to be inadequate for summarizing it. The way I'd characterize it is with at least 2 numbers: one for high-utilization games and another for lower-utilization games. The key point is to alert readers to the fact that their usage experience might put them in the upper range, and to know what that's going to look like. However, they might also happen to fall into a more favorable situation. So, these two numbers would establish soft upper & lower bounds.
Perhaps you feel I'm trying to push a narrative
Nope. I try not to read into people's motives. I just raise issues I see with test methodologies & interpretations of the data and go from there.
Sometimes, when a forum poster is being extremely obstinate, it's hard
not to read some bias into their position, but I always try to start with the assumption they have an open mind and the same interest in knowledge & understanding that I do.
... that Nvidia's power on the 40-series isn't that bad.
I'm critical of the way
everyone seems to be stretching the power envelope, and Nvidia is certainly leading the way. However, whether it makes the product "bad" is in the eye of the beholder. The main thing I want is good data and sensible interpretations, so that users can make informed decisions and companies can be held to account (where appropriate).
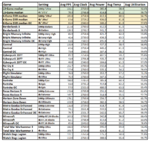
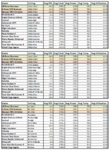
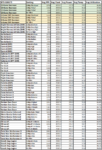
Sure, 3090 Ti isn't going to hit 450W at 1080p either. Actually, I have that data right here, if I just pull it into a spreadsheet. This is the full 14-game test suite at all settings/resolutions, just retested two days ago. Let me see...
View attachment 163
Somewhat similar patterns to the 4090, but as expected GPU utilization is much higher. I don't need to toss out any of the results to tell the narrative that the 3090 Ti uses over 400 W in most cases.
If we apply the same standard (95% utilization threshold), then I see the same pattern - nearly all high-utilization games/settings are above 400 W, while only Fortnite (DXR) and Minecraft (RT) are above 400 W with less than 95% utilization. Most below 95% are
much lower than 400 W.
This is not correct. My previous version used a different calculation rather than median. Which is precisely what I wanted. It did not discount them, it gave them equal weight.
Do you understand what the median
is? It's literally the half-way point. It's telling you half of the data are above that point and half are below. If the median is above the figure that you reported, the logical consequence is that your figure is too low to characterize more than
half of the data!
Again, your original figures were 345.3 and 399.4, but the median values you computed were 385.4 and 414.8. That shows your original figures
significantly discounted more than half of the games!
You actually filtered out data to select three games at 1440p. You discounted 10 of 13 games to give those numbers.
As I already explained, I never intended those > 95% numbers to be shown in isolation. Before my reply, you could be forgiven for not knowing that, but I told you and you seem to be ignoring that. I hope we're clear, by this point.
Perhaps it's just that I run all the tests on these cards and so the results have meaning to me.
If the tests were conducted properly, then they all
do have meaning. The issue is that there's only so much meaning a single number can hold.
They take time out of my life and I want them to be seen. LOL.
I know, and they all should be. It's only by seeing the per-game results that someone can figure out what to expect from the games they play. So, not only are the gross metrics important, but also the per-game measurements which feed into them.
Anyway, I can toss extra rows in showing average and median alongside the geomean... but I do worry it gets into the weeds quite a bit.
I'm not hung up on median. It's not magic, just a little better at characterizing "typical" than mean.
What I'm more interested in is looking at the shape and spread of the distribution. Maybe I'll get the plots posted up that I made of that (it was a little tricky for me to figure out how to make a histogram with Excel 2013). But my $0.02 is really that you have the high-utilization scenarios that cluster pretty tightly at one end of the spectrum, and then you have a long tail of lower-utilization games. 2 numbers characterize that better than 1, but I guess it's hard to beat a plot that shows the full picture.
Thanks, again, for your diligence and hashing this out. Best wishes to your and your family, this holiday weekend!
: )


