News AMD Backs Off RDNA 3 Efficiency Comparison to RTX 4090

Page 2 - Seeking answers? Join the Tom's Hardware community: where nearly two million members share solutions and discuss the latest tech.
BS. They don't.
Don't be a tool. Sure, AMD reports GPU-only power draw and that might be accurate. This is not the same as Board Power, which AMD absolutely does NOT report via software on the currently existing cards. Hence, it "lies."

There are plenty of sites that don't do proper power testing. It's time consuming and more difficult. So you'll get idiots that say things like, "Look, AMD's RX 6750 XT only uses 230W while running FurMark." In actual fact, the Asus card I tested draws over 280W. Here's a snippet of the data (and I'm sorry BBcode tables suck):

Real Power UseGPU-Z Reported Power
16.1345
16.1755
16.2075
16.1365
15.5935
16.3425
16.15
16.4175
16.2935
16.165
16.2085
16.0615
16.2455
16.3665
16.3935
16.3475
16.0385
16.6935
22.8685
29.6987
101.387
294.585215
297.646215
254.709215
283.165215
282.084215
281.926230
281.328230
283.086230
282.186230
281.596229
283.207229
282.626230
281.781230
282.131230
282.222230
281.608230
281.766230
282.144230
282.16229
283.203229
281.059229
282.124229
283.401229
285.476229
280.049229
282.311229
281.498229
282.474230
282.145230
281.94229

Average power use under load: 282.8W
Average GPU-Z power reported: 229.5W

Perhaps the GPU chip really does only use 230W, but that doesn't really help if you're comparing it with an Nvidia card that reports board power, and it doesn't help if you're wondering how much power your PSU needs to provide. On this particular card, the board uses up to 53W more power than what software tools like GPU-Z or MSI Afterburner will report. That's 23% more power, and on some cards, the gap is even wider! (I've seen up to a 35% discrepancy.)
 

King_V

Illustrious
Ambassador
(detailed data snipped)

So based on those results, the 4090 was more efficient than the 4080 at 4K ultra settings! Sadly, I don't have full matching data for other GPUs (YET!), but I'll definitely be capturing that on future testing. I'm going to be retesting everything on a new 13900K testbed in the coming weeks/months as well, using FrameView and PCAT v2 to measure real power data, and that should prove quite interesting.

@JarredWaltonGPU - thanks for the full tables and detailed analysis. Yep, I expect the RTX 4000 series are going to do significantly better than the RX 7000 series.

But, damn, the 4090 being more efficient than the 4080 was definitely not something I would've expected. It always seemed before that the upper-end cards are pushing their architecture deep into the "point of diminishing returns" zone when it came to squeezing out more performance.

Intriguing, too, that, not counting ray-tracing, for AMD, the 6600XT was the most efficient at 1080p, slipping only a hair behind the 6700XT at 4K. Of course, I perversely wonder if the 6600 non-XT outdoes them both... uh, at 1080p. I can't imagine the 6600 non-XT at 4K.


In any case, I am really looking forward to when you get the data for all the cards. Are you definitely getting PCAT?
 
In any case, I am really looking forward to when you get the data for all the cards. Are you definitely getting PCAT?
I would assume so. I've requested one from Nvidia, the PCAT v2. Funny thing is that... apparently Nvidia didn't include support for enough connectors for certain AMD GPUs? (Maybe they need four 8-pin connections? Certainly at least three.) They're supposed to have everything needed to ship units soon-ish. But then I have to wonder... is Nvidia going to ship it with a native 12-pin or 16-pin connector? Because honestly... that would be bad.

I'm imagining swapping that 12-pin/16-pin connector through every GPU that I test, and retest, and then test on some new game, etc. I've noted elsewhere that I probably swap GPUs in my primary testbed easily 200-300 times a year, perhaps as many as 500 times. I notice over time that even 8-pin connectors can start to feel a bit worn out. I can only imagine the 12-pin portion of the new adapter would go bad significantly faster! I make it a point of generally leaving the 12/16-pin adapters installed on the Nvidia GPUs, so I'm only normally swapping the 8-pin connections.

When I get the PCAT v2, I'm also planning to upgrade to a 13900K testbed. So really, I'm not going to start retesting until I have both! LOL. And then once I have everything I need, it's about a solid day's worth of testing to get all the benchmarks from one card (assuming a few interruptions).
 
  • Like
Reactions: King_V

bit_user

Polypheme
Ambassador
The point wasn't that the 4090 uses 221W, but that it also doesn't generally use the listed 450W either.
That's not accurate. You're taking the mean to represent the typical case, but median is actually a better measure of that.

If you look a the Gigabyte RTX 4090 review's power page, or the MSI RTX 4090 review's power page, both have full data on power use under most of the tests. (RDR2 doesn't because that game crashes if you try to use FrameView with it.) Here's a better view of the GB results from Excel, which doesn't munge the tables like our CMS:

View attachment 158

Across all 13 games, it averaged just under 400W at 4K and under 350W at 1440p.
Clearly, what's happening is the games which under-utilize the GPU are dragging down the average. If you computed the mean across only the games which utilize it >= 95%, the picture would look significantly different.

Why does this matter? Well, if I buy a GPU and my main games happen to be ones that utilize it > 95%, then the 13-game mean gives me a false expectation of how it will behave for me.

Only in DXR testing did it get pretty close to the 450W figure, where it averaged 432W.
When I compute the mean across the games I listed above, here's what I get:

TestResolutionAvg ClockAvg PowerAvg TempAvg Utilization
3-game average1440p
2758.7
422.2
60.0
97.8%
8-game average4k
2725.4
428.9
61.4
97.9%
Borderlands 34k
2740.7​
441.7​
63.4​
98.9%​
Bright Memory Infinite1440p
2758.6​
421.7​
62.3​
99.0%​
Bright Memory Infinite4k
2730.0​
436.3​
63.5​
99.0%​
Control1440p
2759.0​
437.3​
58.4​
98.9%​
Control4k
2718.4​
445.2​
61.3​
99.0%​
Cyberpunk 20771440p
2758.6​
407.5​
59.2​
95.6%​
Cyberpunk 20774k
2706.8​
435.7​
60.9​
97.3%​
Fortnite4k
2735.2​
414.8​
62.2​
95.5%​
Metro Exodus Enhanced4k
2651.8​
444.5​
63.0​
98.6%​
Total War Warhammer 34k
2759.8​
424.5​
61.1​
98.3%​
Watch Dogs Legion4k
2760.3​
388.5​
55.4​
96.7%​

It paints a very different picture. I did not include FPS, because I think a straight average across different games is also misleading.

So based on those results, the 4090 was more efficient than the 4080 at 4K ultra settings!
This isn't surprising, given that they're made with different dies. Bigger dies are harder to fully-utilize, which means the 4090 should typically run at lower utilization than the 4080. That's an efficiency win, right there. Also, the base & boost clocks of both GPUs are rated the same, and if the 4090 only gets extra performance by virtue of more die area & memory channels, then it should scale well.

Furthermore, is the 4080's memory clocked higher? Wikipedia says so. That would be another factor working against it.
 
Last edited:

bit_user

Polypheme
Ambassador
damn, the 4090 being more efficient than the 4080 was definitely not something I would've expected. It always seemed before that the upper-end cards are pushing their architecture deep into the "point of diminishing returns" zone when it came to squeezing out more performance.
You have to look at the details, like die size and clock speed. Not just the model numbers.

When the upper-end card is just a faster-clocked version, with a few more CUDA cores and memory channels enabled, then efficiency will be worse. However, in this case, it's a much bigger die with the same base/boost clocks and memory clocks that are actually lower.

Why did Nvidia do this? Well, when you're pushing as hard on the power envelope as they are, you can't afford to scale inefficiently. Also, recent GPU price trends probably convinced them such a large GPU would still be profitable.
 
  • Like
Reactions: King_V
That's not accurate. You're taking the mean to represent the typical case, but median is actually a better measure of that. Clearly, what's happening is the games which under-utilize the GPU are dragging down the average. If you computed the mean across only the games which utilize it >= 95%, the picture would look significantly different. Why does this matter? Well, if I buy a GPU and my main games happen to be ones that utilize it > 95%, then the overall mean gives me a false expectation of what to expect.
I love when people suggest I'm intentionally manipulating numbers, and then do the same exact sort of manipulation! Seriously? Of course the power use will go up if we eliminate games where the GPU isn't used as much.

Also, I didn't use a straight average, I used the geometric mean where all the games get equal weight. Why? Because that's certainly more "fair" than intentionally leaving out some numbers. Both arithmetic mean and median skew in different ways. No group of statisticians will ever agree that only one type of mean/median is "best" but I think equal weighting at least has more value in a lot of situations. Here's the median results, incidentally, which basically says "ignore the outliers" — even though outliers are still entirely valid.
159
When I compute the mean across the games I listed above, here's what I get:

TestResolutionAvg ClockAvg PowerAvg TempAvg Utilization
3-game average1440p
2758.7
422.2
60.0
97.8%
8-game average4k
2725.4
428.9
61.4
97.9%
Borderlands 34k
2740.7​
441.7​
63.4​
98.9%​
Bright Memory Infinite1440p
2758.6​
421.7​
62.3​
99.0%​
Bright Memory Infinite4k
2730.0​
436.3​
63.5​
99.0%​
Control1440p
2759.0​
437.3​
58.4​
98.9%​
Control4k
2718.4​
445.2​
61.3​
99.0%​
Cyberpunk 20771440p
2758.6​
407.5​
59.2​
95.6%​
Cyberpunk 20774k
2706.8​
435.7​
60.9​
97.3%​
Fortnite4k
2735.2​
414.8​
62.2​
95.5%​
Metro Exodus Enhanced4k
2651.8​
444.5​
63.0​
98.6%​
Total War Warhammer 34k
2759.8​
424.5​
61.1​
98.3%​
Watch Dogs Legion4k
2760.3​
388.5​
55.4​
96.7%​

It paints a very different picture. I did not include FPS/W, because I think a straight average across different games is also misleading.
Everything can be misleading, including only looking at the most demanding games (DXR for example). Mislabeling charts can also be misleading! Did you mean to have 3-game average at 1440p, or is that still at 4K? I don't know, especially since I don't know which three games you selected!

161

And a larger die size isn't really meaningful as an indication that it would use more or less power. Similar clocks, and similar utilization, would generally drive up power use proportional to die size. That's why the AD102 is bigger and has a higher TDP (TBP) to allow it to stretch its legs. But actually fully taxing it can be difficult, even at 4K, which is the whole point of this efficiency discussion in the first place.

In strict performance per watt, using less power or providing higher performance are both beneficial. If everything used its maximum board power, we wouldn't need to look at per-game results. But as soon as you question the inclusion of results from certain games, we might as well just go to questioning any and all games tested.

I can absolutely make the 4090 look more power hungry if I only use Borderlands 3, Metro Exodus Enhanced, and Control. Does that make it less misleading, or more misleading? I'd suggest intentionally eliminating all but the three most power hungry games from a long-established test suite just to prove a point is the very definition of misleading. When I picked the games I was testing nearly a year ago, I did not go out of my way to try and select outliers (except perhaps with Flight Simulator which was known to be CPU limited in many situations).

Frankly, going into a look at "typical power use" with a filter that says "only include games with >= 95% utilization" is the exact sort of crap that invalidates results. Maybe I should do all GPU testing that way! "Oops, the XYZ card didn't hit >95% utilization, so I better drop that from the charts!" Or put another way, maybe we should just start with a requirement that we only look at power use for games that use more than 440W of power. The results of such biased filtering of data become immediately apparent, for example with the RTX 4080:

160

OMG, look! The RTX 4080 draws 284W at 1080p, 301W at 1440p, and 290W at 4K! Never mind that it's only using data from four games at 1080p, five games at 1440p, but 12 games at 4K. 🤔
 

bit_user

Polypheme
Ambassador
I love when people suggest I'm intentionally manipulating numbers,
I said nothing about intent.

and then do the same exact sort of manipulation! Seriously?
I made the case for why I think a mean average is potentially misleading and proposed an alternative + my rationale. You can debate my rationale, but please don't attack me.

Also, my table wasn't meant to stand in isolation - I'm sorry that wasn't clear. It was meant to convey power usage among higher-utilization games, only. It was not intended to present the whole picture, contrary to what you're presuming. What I had in mind is that your table include rows with averages like the ones I computed, perhaps along with averages of the games < 95%. The reason I included a whole table, in my post, was to show the specific games contributing to it.

Of course the power use will go up if we eliminate games where the GPU isn't used as much.
Isn't that the real story? That power increases nonlinearly with respect to utilization? And that many games underutilize it, especially at lower resolutions?

Because that's certainly more "fair" than intentionally leaving out some numbers.
Is it? What's fair cannot be judged without context. And the ultimate context for a reviews site like this is a prospective buyer. The expectation must be set with the end user, so they can make the appropriate decisions.

Both arithmetic mean and median skew in different ways. No group of statisticians will ever agree that only one type of mean/median is "best"
I understand the allure of boiling it down to one number, but you just can't. If the distribution of power consumption across games is lumpy or broad, you have to say that.

Here's the median results, incidentally, which basically says "ignore the outliers" — even though outliers are still entirely valid.
My point about "median" was mostly limited to your statement. The typical game will generally be closer to the median than the mean. Outliers can affect the median, but not in the disproportionate way they can skew a mean.

Another nice property of the median is that at least one game will actually match it. If you had a bi-modal distribution, the mean could be a phantom value that no single game will ever match.

Note how the average power is higher? This is telling us that your previous version had figures which discounted more than half of the games! Is that what you want?

Did you mean to have 3-game average at 1440p, or is that still at 4K? I don't know, especially since I don't know which three games you selected!
It was the three 1440p games included in my table - the only three to exceed my 95% utilization threshold.

And a larger die size isn't really meaningful as an indication that it would use more or less power. Similar clocks, and similar utilization, would generally drive up power use proportional to die size.
Having a larger die, made on the same process node and architecture, with the same clocks? That should scale linearly with power. The only real question is how linearly performance scales.

Now, if that were the whole story, then you'd expect to see the larger die deliver worse efficiency, because performance scaling is never perfectly linear. However, the two ways I think the 4090 delivers better efficiency are:
  1. lower memory clocks
  2. the nonlinear relationship between % utilization and power consumption

Because of #2, any lack of performance scaling is more than offset by less power utilization! Hence, it's naturally more efficient! This shouldn't be surprising.
 
I said nothing about intent.
...snip...
Look, your first statement started with what felt like an attack to me: "That's not accurate. You're taking the mean to represent the typical case, but median is actually a better measure of that." That's a description of "intent" if I ever heard one.

I apologize for responding in kind. I still strongly disagree with many of your opinions. Like is median actually the best? Obviously I don't think so. There's also no "medianif" function, or a "geomeanif" for that matter, which sort of stinks. But it's easy to list potential data sets that will make median look stupid, like this:

2,2,2,2,10,10,10. Median = 2; Average = 5.4; Geomean = 4.0

That's a contrived data set, so look at the numbers from the power/etc. data instead, as they're probably more useful and less varied. 4080, 13-game power testing:

PowerGeomeanAverageMedian
1080p223.8231.2256.4
1440p250.0254.4255.8
4K289.0289.9294.9

Outside of 1080p, the results for any of the three options aren't going to differ that much. 1080p skews high (makes Nvidia's power look worse); geomean skews low (Nvidia's power looks better). Why is one of those more desirable, unless you're trying to make the numbers skew? Which is the problem with so many statistics: they're chosen to create a narrative.

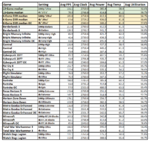
Perhaps you feel I'm trying to push a narrative that Nvidia's power on the 40-series isn't that bad. I am to a degree, but it's based on my testing of the cards. If I pull up data like the above for a different GPU, prior to Ada Lovelace most cards were coming far closer to TBP while gaming. Sure, 3090 Ti isn't going to hit 450W at 1080p either. Actually, I have that data right here, if I just pull it into a spreadsheet. This is the full 14-game test suite at all settings/resolutions, just retested two days ago. Let me see...

163

Somewhat similar patterns to the 4090, but as expected GPU utilization is much higher. I don't need to toss out any of the results to tell the narrative that the 3090 Ti uses over 400W in most cases.
Note how the average power is higher? This is telling us that your previous version had figures which discounted more than half of the games! Is that what you want?
This is not correct. My previous version used a different calculation rather than median. Which is precisely what I wanted. It did not discount them, it gave them equal weight. You actually filtered out data to select three games at 1440p. You discounted 10 of 13 games to give those numbers.

Perhaps it's just that I run all the tests on these cards and so the results have meaning to me. They take time out of my life and I want them to be seen. LOL. Someone else comes along and says, "I don't like your data" and throws out half of it and that hurts my heart.

Anyway, I can toss extra rows in showing average and median alongside the geomean... but I do worry it gets into the weeds quite a bit.
 

bit_user

Polypheme
Ambassador
Look, your first statement started with what felt like an attack to me: "That's not accurate. You're taking the mean to represent the typical case, but median is actually a better measure of that." That's a description of "intent" if I ever heard one.
No, it's not a statement of intent. If I said you were trying to bias the results by using the mean to represent the typical case, that would be a statement of intent. Merely pointing out a discrepancy is not the same as alleging impure motives.

Just so we're clear: I never thought you were intentionally trying to mislead anyone. However, I do think your methodology is having that effect. I have a lot of respect for you and all the effort and diligence you put into your testing & articles. Further, I appreciate your engagement with us, in the forums.

Like is median actually the best? Obviously I don't think so.
Agreed, it's not the best. I just wanted to counter your statement with what I believe to be a better predictor of the typical case.

There's also no "medianif" function, or a "geomeanif" for that matter, which sort of stinks.
If you need another conditional, perhaps you can make an extra, hidden column?

But it's easy to list potential data sets that will make median look stupid, like this:
Now we're getting into the heart of the issue, which is this: when is mean a particularly poor predictor of the typical case? I contend this is true whenever your distribution is skewed or lopsided. I actually made plots of the power distribution from your data, but I need to find somewhere to host them. Anyway, just by eyeballing the data, you can see the distribution isn't symmetrical.

Outside of 1080p, the results for any of the three options aren't going to differ that much.
Using my criteria of 95% utilization, the games below that threshold compute as follows:

TestResolutionAvg ClockAvg PowerAvg TempAvg Utilization
10-game average1440p
2747.8
332.5
56.2
79.8%
5-game average4k
2757.4
358.6
56.9
86.5%
Borderlands 31440p
2760.0​
412.5​
61.5​
92.7%​
Far Cry 61440p
2760.0​
232.6​
51.1​
65.7%​
Far Cry 64k
2760.0​
335.1​
54.2​
94.4%​
Flight Simulator1440p
2760.0​
353.7​
57.2​
71.1%​
Flight Simulator4k
2760.0​
347.1​
55.2​
70.9%​
Fortnite1440p
2745.0​
385.4​
60.9​
93.8%​
Forza Horizon 51440p
2769.8​
251.1​
50.2​
82.6%​
Forza Horizon 54k
2760.0​
314.9​
55.5​
92.7%​
Horizon Zero Dawn1440p
2760.6​
256.7​
51.9​
65.7%​
Horizon Zero Dawn4k
2758.0​
382.1​
58.5​
94.7%​
Metro Exodus Enhanced1440p
2729.0​
418.7​
61.4​
92.6%​
Minecraft1440p
2670.0​
342.8​
56.8​
66.4%​
Minecraft4k
2748.8​
413.6​
61.2​
80.0%​
Total War Warhammer 31440p
2760.0​
395.9​
59.8​
94.4%​
Watch Dogs Legion1440p
2763.4​
275.2​
50.8​
72.8%​

These numbers, 332.5 and 358.6 Watts, are also somewhat different than your 13-game averages of 345.3 and 399.4 (respectively) and very different than the > 95% utilization numbers of 422.2 and 428.9 Watts. So, it's really a tale of two usage scenarios: high-utilization and lower-utilization.

Why is one of those more desirable, unless you're trying to make the numbers skew? Which is the problem with so many statistics: they're chosen to create a narrative.
As I said before, when the situation is complex, a single number is going to be inadequate for summarizing it. The way I'd characterize it is with at least 2 numbers: one for high-utilization games and another for lower-utilization games. The key point is to alert readers to the fact that their usage experience might put them in the upper range, and to know what that's going to look like. However, they might also happen to fall into a more favorable situation. So, these two numbers would establish soft upper & lower bounds.

Perhaps you feel I'm trying to push a narrative
Nope. I try not to read into people's motives. I just raise issues I see with test methodologies & interpretations of the data and go from there.

Sometimes, when a forum poster is being extremely obstinate, it's hard not to read some bias into their position, but I always try to start with the assumption they have an open mind and the same interest in knowledge & understanding that I do.

... that Nvidia's power on the 40-series isn't that bad.
I'm critical of the way everyone seems to be stretching the power envelope, and Nvidia is certainly leading the way. However, whether it makes the product "bad" is in the eye of the beholder. The main thing I want is good data and sensible interpretations, so that users can make informed decisions and companies can be held to account (where appropriate).

Sure, 3090 Ti isn't going to hit 450W at 1080p either. Actually, I have that data right here, if I just pull it into a spreadsheet. This is the full 14-game test suite at all settings/resolutions, just retested two days ago. Let me see...

View attachment 163

Somewhat similar patterns to the 4090, but as expected GPU utilization is much higher. I don't need to toss out any of the results to tell the narrative that the 3090 Ti uses over 400 W in most cases.
If we apply the same standard (95% utilization threshold), then I see the same pattern - nearly all high-utilization games/settings are above 400 W, while only Fortnite (DXR) and Minecraft (RT) are above 400 W with less than 95% utilization. Most below 95% are much lower than 400 W.

This is not correct. My previous version used a different calculation rather than median. Which is precisely what I wanted. It did not discount them, it gave them equal weight.
Do you understand what the median is? It's literally the half-way point. It's telling you half of the data are above that point and half are below. If the median is above the figure that you reported, the logical consequence is that your figure is too low to characterize more than half of the data!

Again, your original figures were 345.3 and 399.4, but the median values you computed were 385.4 and 414.8. That shows your original figures significantly discounted more than half of the games!

You actually filtered out data to select three games at 1440p. You discounted 10 of 13 games to give those numbers.
As I already explained, I never intended those > 95% numbers to be shown in isolation. Before my reply, you could be forgiven for not knowing that, but I told you and you seem to be ignoring that. I hope we're clear, by this point.

Perhaps it's just that I run all the tests on these cards and so the results have meaning to me.
If the tests were conducted properly, then they all do have meaning. The issue is that there's only so much meaning a single number can hold.

They take time out of my life and I want them to be seen. LOL.
I know, and they all should be. It's only by seeing the per-game results that someone can figure out what to expect from the games they play. So, not only are the gross metrics important, but also the per-game measurements which feed into them.

Anyway, I can toss extra rows in showing average and median alongside the geomean... but I do worry it gets into the weeds quite a bit.
I'm not hung up on median. It's not magic, just a little better at characterizing "typical" than mean.

What I'm more interested in is looking at the shape and spread of the distribution. Maybe I'll get the plots posted up that I made of that (it was a little tricky for me to figure out how to make a histogram with Excel 2013). But my $0.02 is really that you have the high-utilization scenarios that cluster pretty tightly at one end of the spectrum, and then you have a long tail of lower-utilization games. 2 numbers characterize that better than 1, but I guess it's hard to beat a plot that shows the full picture.

Thanks, again, for your diligence and hashing this out. Best wishes to your and your family, this holiday weekend!
: )
 
  • Like
Reactions: JarredWaltonGPU