I think the better argument here is, the 99th percentile should be included as it is useful metric overall, but so too is the average.
I agree on the textures, those are GPU level objects. However, when loaded from disk they can be re-referenced which can have some CPU cache implications depending on how the texture loading engine is written. It's not likely to make a huge difference, but wanted to point that part out.
99th percentiles ARE included. I'm not sure what you're looking at.
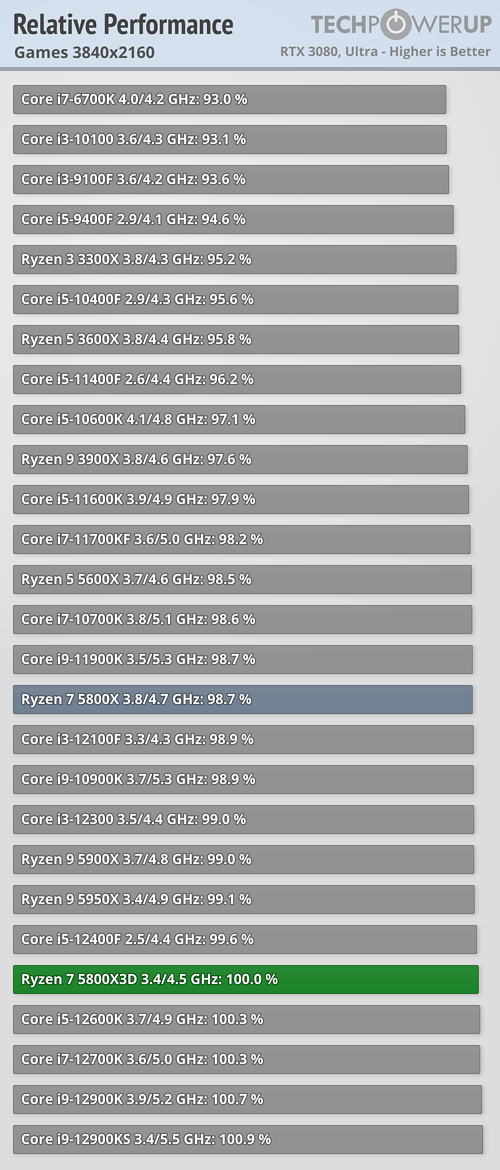
If you give equal weighting to all of those, the 5800X3D still delivers higher overall 99th percentile results.
The problem with only focusing on 99th percentiles is that they're far, FAR more variable than average fps results. I benchmark GPUs all the time, and I run each game/setting combination at least three times. Where I often see a ~0.5% difference maximum in average fps, depending on the game, the 99th percentile fps can swing by as much as 10% in some cases. It's because all it takes is one or two bad frame stutters, which won't occur every time or even consistently. Look at the results in the above charts. The 5900X PBO should in theory never be slower than the stock 5900X, and the same goes for the stock vs. OC Intel CPUs. That's
usually the case, but there are exceptions. F1 2021, Far Cry 6, and Watch Dogs Legion all show some 99th percentile fluctuations that are relatively common.
What dgbk says isn't completely wrong, because minimums
are important, but basing all testing solely off minimum or 99th percentile fps would be horribly prone to abuse. What should we do, benchmark each game five times and average all the results to get a consensus? But one really bad run could still skew things, so maybe let's do each game ten times! Now we're spending substantially more time testing, which absolutely isn't viable — we already often end up pulling all nighters just to hit embargo, without running lots of extra tests.
The reality is that talking in theoreticals and showing data sets like "105,105,105,105,105" versus "100,100,200,100,100" makes the problems mentioned sound possible, but in reality we're looking at THOUSANDS of frametimes collected on benchmark runs, so things really do average out. The relatively few outliers don't generally skew the average, but because the 99th percentile only looks at 1% of the data by nature, a data set of 26,000 frames as an example gets reduced to 260 frames.
This is why we don't use the absolute minimum fps over a run. The RTX 3090 Ti for instance averaged 184.25 fps at 1080p ultra in Borderlands 3, the 99th percentile fps was 141.02, the 99.9th percentile was 82.23, and the minimum instantaneous fps was 22.67. But if I did a dozen runs of that game at those settings on a single GPU, the standard deviation for the minimum fps would likely fall in the range of 10–15 fps. Maybe we should report the standard deviation of the frametimes (or framerates) as a secondary metric? But then everyone would need to get a better foundation in statistics to even grok what our charts are showing.
Basically, KISS applies here. Showing seven more charts analyzing all of the intricacies of performance for each game on each CPU/GPU would only be of interest to 0.01% of the readers. And even then, because it's now a matter of statistics, opinions on which metrics are the most important would still crop up and we're back to square one, having now wasted lots of time.
Lies, Damned Lies, and Statistics. Average fps is the standard because it really does mean something and it's less prone to wild fluctuations. 99th percentile fps and minimum fps mean something as well, so they're not useless, but if I were weighting things I'd say 99th percentile results only count for about 10% as much as average results. And if they're really bad for a particular set of hardware compared to its direct competition, it implies a problem with the benchmark/software/drivers/etc. more than anything.


