Discussion: AMD Ryzen

Page 80 - Seeking answers? Join the Tom's Hardware community: where nearly two million members share solutions and discuss the latest tech.
Status
Not open for further replies.

juanrga

Distinguished
BANNED
Mar 19, 2013
5,278
0
17,790
[quotemsg=19246630,0,528675]I am officially calling the leak BS and I have some graphical evidence of it. To be fair it wasn't really hard.

o107rt.jpg

I have red ringed the problems with the bench but please pay particular interest to the CPU ID.

AMD-Ryzen-3.63.9-GHz-Turbo-Clock.jpg


AMD's official CES2017 ES running, notice the CPU ID in device manager.

The two give aways:

1) AMD Ryzen is not used, Engineering Sample is used in the string.

2) N implies no iGPU, the AOTS states Y

[/quotemsg]

If anything this points in the opposite direction. The _N was for the early ES (engineering samples). The _Y is for PC (production candidate) chips. Notice also the steeping. At CES, AMD used a F3 sample, those recent chips are all F4, which is the final silicon steeping. The string that appears in the AoS leak (ZD3601BAM88F4_40/36_Y) corresponds to a real recent chip.

ZD3601BAM88F4_40/36_Y is a 8C/16T with a base clock of 3640 MHz. Another 8C model is the ZD3406BAM88F4_38/34_Y with a base clock of 3393 MHz. There are no other 8C model known.
 

juanrga

Distinguished
BANNED
Mar 19, 2013
5,278
0
17,790
[quotemsg=19246415,0,1280575]6900K @ 4.0 GHz + Titan X Pascal at various resolutions:

https://www.pugetsystems.com/pic_disp.php?id=40804&width=800&height=800

It only gives average, but shows 65 FPS average on Crazy settings @ 4K

That means that Ryzen @ 3.6-4.0 is not far off at all if this is accurate.[/quotemsg]

That 6900K is running @3.2GHz, not 4GHz.

https://www.pugetsystems.com/labs/articles/Titan-X-Performance-PCI-E-3-0-x8-vs-x16-851/

Moreover adding a second GPU increases performance in the 4K set, which implies the CPU is not working at its max potential in the single-GPU 4K bench because the GPU is a bottleneck. All this means we cannot use this bench to compare CPU performances.
 
[quotemsg=19247137,0,1284262][quotemsg=19246630,0,528675]I am officially calling the leak BS and I have some graphical evidence of it. To be fair it wasn't really hard.

o107rt.jpg

I have red ringed the problems with the bench but please pay particular interest to the CPU ID.

AMD-Ryzen-3.63.9-GHz-Turbo-Clock.jpg


AMD's official CES2017 ES running, notice the CPU ID in device manager.

The two give aways:

1) AMD Ryzen is not used, Engineering Sample is used in the string.

2) N implies no iGPU, the AOTS states Y

[/quotemsg]

If anything this points in the opposite direction. The _N was for the early ES (engineering samples). The _Y is for PC (production candidate) chips. Notice also the steeping. At CES, AMD used a F3 sample, those recent chips are all F4, which is the final silicon steeping. The string that appears in the AoS leak correspond to a real recent chip.

ZD3601BAM88F4_40/36_Y is a 8C/16T with a base clock of 3640 MHz. Another 8C model is the ZD3406BAM88F4_38/34_Y with a base clock of 3393 MHz. There are no other 8C model known.
[/quotemsg]

No it is not, F3 or F4 refers to release, the Y/N is iGPU which has always been a N why all of a sudden is it a Y, either way it was a fake and AOTs removed the bench for zero validity.

last official ES: AMD Engineering Sample ( NOT RYZEN) 1D3601A2M88F3_3.9/3.6_N when something is scewed to absolute proportions.
 

salgado18

Distinguished
Feb 12, 2007
903
335
19,370
Can anyone point me to a reliable source which shows that ZD3601BAM88F4_40/36_Y and 1D3601A2M88F3_3.9/3.6_N are valid part numbers? Everywhere I look but Zen leaks show the part number ending at the stepping, and Ashes of Singularity shows the name string of the cpu, not the part number. A retail/oem Ryzen, especially with final clocks, would have a name string wouldn't it?

Also, the results list on their site has no search funcionality, doesn't show the CPU unless you click the result, and is very bad at finding any specific result. If not impossible, what are the chances someone finds this specific benchmark (which was not posted anywhere else, but on the main site)?

And all of the benches around there point to version 2.x of the game. Why on earth would anyone test the latest secret AMD superweapon on a very old tool? One which is not standard like Cinebench, where it makes sense to use R11.5 for example.

I call it fake.
 

juanrga

Distinguished
BANNED
Mar 19, 2013
5,278
0
17,790
[quotemsg=19246010,0,133194]EDIT 2

"Half" resolution terrain, not "High" resolution Terrain. That plus the sample difference are likely dragging AMD's results down. Not sure what to make of this here, as I'm being told by some people 1.50 is a newer version then 2.2. Can anyone please elaborate here?[/quotemsg]

Yes, 1.50.24210 is the last version/patch released last month.

https://www.gog.com/forum/ashes_of_the_singularity/changelog
 
[quotemsg=19246415,0,1280575]6900K @ 4.0 GHz + Titan X Pascal at various resolutions:

https://www.pugetsystems.com/pic_disp.php?id=40804&width=800&height=800

It only gives average, but shows 65 FPS average on Crazy settings @ 4K

That means that Ryzen @ 3.6-4.0 is not far off at all if this is accurate.[/quotemsg]

Different preset.

Again, I went directly to the AoS website, and pulled the closest comparable benchmark comparison that I could.
 
[quotemsg=19247282,0,1284262][quotemsg=19246010,0,133194]EDIT 2

"Half" resolution terrain, not "High" resolution Terrain. That plus the sample difference are likely dragging AMD's results down. Not sure what to make of this here, as I'm being told by some people 1.50 is a newer version then 2.2. Can anyone please elaborate here?[/quotemsg]

Yes, 1.50.24210 is the last version/patch released last month.

https://www.gog.com/forum/ashes_of_the_singularity/changelog[/quotemsg]

Stupid versioning.

From what I can see, AMD turned up two settings which is giving them a lower overall score. That might also be why I can't find a comparison on the AoS website, as it only lists the top results. It might be the Crazy preset in 1.5 was changed and is partly responsible. IDK really.

Or this could be fake. Not enough information to determine either way.

I think we're at the point where we need someone here with an Intel CPU + Titan X to give this a run at the same settings AMD used with version 1.5. I'll google-fu and see if I can find some Titan X results on 1.5 later tonight after work, but I'm not terribly optimistic.

The other option would be for me to guesstimate the difference between a Titan X and 1080 GTX and run a comparison myself using my 2600k/1080 GTX combo. Though I'd like to keep the GPU constant if at all possible. [I'm not sure how the CPU Framerate fluctuates with GPU. If it doesn't matter, then I can use the 2600k as a direct comparison myself.]

I'll research tonight. Sounds like a fun project.
 
[quotemsg=19246010,0,133194][quotemsg=19245598,0,25866]check it out:

http://wccftech.com/amd-ashes-ryzen-4-0-ghz-benchmarks/[/quotemsg]


I can do some rough math, but I don't have a 1:1 exact setting match against an Intel CPU with the Titan X on Crazy defaults. The closest I can find is:

http://www.ashesofthesingularity.com/metaverse#/personas/9ea335b6-9477-494f-8aac-190e1ba785e4/match-details/c14a6de6-6451-49c0-a141-51cbfeafec8a

Which has a lower Terrain Shadowing Sample setting [12 Million versus 16 Million], and is on a much newer version of the benchmark. I'll do the math, but it's almost certainly going to bias Intel due to the settings differences. If anyone has an Intel CPU/Titan X or can find a run with similar settings, just post and I'll re-do the results. For now, this should get a *ballpark* estimate. I'll use the average results/CPU Framerate for now.

Performance = IPC * Clock * Number of Cores

5930k: 84.4 = IPC * 3.5 * 12
IPC = 84.4 / 3.5 / 12
IPC = ~2

Ryzen: 70.5 = IPC * 4 * 16
IPC = 70.5 / 4 / 16
IPC = ~1.10

So according to these results [which I stress: BIAS INTEL due to setting difference, Ryzen has 90% lower IPC on this specific benchmark, likely due to core scaling stalling out after a few cores. Even if you factor in the bias in settings, this...isn't great.

What worries me: Remember the benches from late last year? Where I computed sub-Sandy Bridge IPC? Same thing here: Sub Sandy-Bridge IPC again. Yes, the results have bias due to setting differences, and yes, ES sample, but I doubt the differences account to 90%.

If someone has a run with more accurate settings, post and do the math [it's not hard]. Or I'll do it. I'd be VERY interested in a Titan X run, with an Intel CPU, at the same settings. I'm really starting to think we may have aimed high on IPC.

EDIT

I don't want to say something is screwy here, but AMD is using version 1.50 of the benchmark. Most of the results are showing AoS is well past version 2 [2.2 to be precise]. Am I missing something, or is AMD using an ancient version of the benchmark? And the fact they tested at a higher setting then the default for Crazy is odd to say the least. Oh, and I just saw that Half Resolution Terrain was set to off in the Ryzen results, likely dragging performance down a bit, but 90%.

Putting aside the benchmark/version difference: The Ryzen results for IPC are outright CRAP. AMD better hope this isn't indicative of Ryzen performance, otherwise it's DOA.

Calling all Titan X owners: Run the same version of AoS at the same settings. Please. Because something is seriously off here. And i want to know what.

EDIT 2

"Half" resolution terrain, not "High" resolution Terrain. That plus the sample difference are likely dragging AMD's results down. Not sure what to make of this here, as I'm being told by some people 1.50 is a newer version then 2.2. Can anyone please elaborate here?[/quotemsg]

GamerK you can't use AOTS to scale for IPC like that because it's been proven that despite being DX12 and all, it doesn't scale well above 6 cores- so performance on an Intel 6, 8 and 10 core processor is essentially flat.
 

juanrga

Distinguished
BANNED
Mar 19, 2013
5,278
0
17,790
[quotemsg=19247196,0,528675][quotemsg=19247137,0,1284262][quotemsg=19246630,0,528675]I am officially calling the leak BS and I have some graphical evidence of it. To be fair it wasn't really hard.

o107rt.jpg

I have red ringed the problems with the bench but please pay particular interest to the CPU ID.

AMD-Ryzen-3.63.9-GHz-Turbo-Clock.jpg


AMD's official CES2017 ES running, notice the CPU ID in device manager.

The two give aways:

1) AMD Ryzen is not used, Engineering Sample is used in the string.

2) N implies no iGPU, the AOTS states Y

[/quotemsg]

If anything this points in the opposite direction. The _N was for the early ES (engineering samples). The _Y is for PC (production candidate) chips. Notice also the steeping. At CES, AMD used a F3 sample, those recent chips are all F4, which is the final silicon steeping. The string that appears in the AoS leak correspond to a real recent chip.

ZD3601BAM88F4_40/36_Y is a 8C/16T with a base clock of 3640 MHz. Another 8C model is the ZD3406BAM88F4_38/34_Y with a base clock of 3393 MHz. There are no other 8C model known.
[/quotemsg]

No it is not, F3 or F4 refers to release, the Y/N is iGPU which has always been a N why all of a sudden is it a Y, either way it was a fake and AOTs removed the bench for zero validity.

last official ES: AMD Engineering Sample ( NOT RYZEN) 1D3601A2M88F3_3.9/3.6_N when something is scewed to absolute proportions.
[/quotemsg]

Wrong. F4 is the last steeping. Former F3 steeping was used at CES

http://digiworthy.com/2017/01/05/amd-ryzen-demo-clock-speeds-ces-2017/

And older chips were E4 steeping like the 2D3101A2M88E4_35/31_N.

ZD3601BAM88F4_40/36_Y and ZD3406BAM88F4_38/34_Y are confirmed by third parties. That is why we know exact clocks 3640 MHz and 3393 MHz.

There is no proof that the leak was removed "for zero validity.". It could be removed by violating the NDA. All former leaks of Zen have been removed from Sandra database, Blenchmark database and GeekBench database.
 
[quotemsg=19247305,0,133194][quotemsg=19247282,0,1284262][quotemsg=19246010,0,133194]EDIT 2

"Half" resolution terrain, not "High" resolution Terrain. That plus the sample difference are likely dragging AMD's results down. Not sure what to make of this here, as I'm being told by some people 1.50 is a newer version then 2.2. Can anyone please elaborate here?[/quotemsg]

Yes, 1.50.24210 is the last version/patch released last month.

https://www.gog.com/forum/ashes_of_the_singularity/changelog[/quotemsg]

Stupid versioning.

From what I can see, AMD turned up two settings which is giving them a lower overall score. That might also be why I can't find a comparison on the AoS website, as it only lists the top results. It might be the Crazy preset in 1.5 was changed and is partly responsible. IDK really.

Or this could be fake. Not enough information to determine either way.

I think we're at the point where we need someone here with an Intel CPU + Titan X to give this a run at the same settings AMD used with version 1.5. I'll google-fu and see if I can find some Titan X results on 1.5 later tonight after work, but I'm not terribly optimistic.

The other option would be for me to guesstimate the difference between a Titan X and 1080 GTX and run a comparison myself using my 2600k/1080 GTX combo. Though I'd like to keep the GPU constant if at all possible. [I'm not sure how the CPU Framerate fluctuates with GPU. If it doesn't matter, then I can use the 2600k as a direct comparison myself.]

I'll research tonight. Sounds like a fun project.[/quotemsg]

As far as we're aware this *ISN'T* an official AMD benchmark- but a private individual / someone not working for AMD. That would probably explain the screwy settings (probably not an expert at benchmarks).

That said as I previously mentioned AOTS doesn't scale to enough cores to fully flex an 8c 16t processor (even with a Titan X), so I don't think dividing by core count to solve for IPC is possible in this case. It would probably work with the 4c / 4t small Ryzen cpu as I think AOTS is sufficient to 'max out' that type of cpu.
 
[quotemsg=19247331,0,1282978][quotemsg=19246010,0,133194][quotemsg=19245598,0,25866]check it out:

http://wccftech.com/amd-ashes-ryzen-4-0-ghz-benchmarks/[/quotemsg]


I can do some rough math, but I don't have a 1:1 exact setting match against an Intel CPU with the Titan X on Crazy defaults. The closest I can find is:

http://www.ashesofthesingularity.com/metaverse#/personas/9ea335b6-9477-494f-8aac-190e1ba785e4/match-details/c14a6de6-6451-49c0-a141-51cbfeafec8a

Which has a lower Terrain Shadowing Sample setting [12 Million versus 16 Million], and is on a much newer version of the benchmark. I'll do the math, but it's almost certainly going to bias Intel due to the settings differences. If anyone has an Intel CPU/Titan X or can find a run with similar settings, just post and I'll re-do the results. For now, this should get a *ballpark* estimate. I'll use the average results/CPU Framerate for now.

Performance = IPC * Clock * Number of Cores

5930k: 84.4 = IPC * 3.5 * 12
IPC = 84.4 / 3.5 / 12
IPC = ~2

Ryzen: 70.5 = IPC * 4 * 16
IPC = 70.5 / 4 / 16
IPC = ~1.10

So according to these results [which I stress: BIAS INTEL due to setting difference, Ryzen has 90% lower IPC on this specific benchmark, likely due to core scaling stalling out after a few cores. Even if you factor in the bias in settings, this...isn't great.

What worries me: Remember the benches from late last year? Where I computed sub-Sandy Bridge IPC? Same thing here: Sub Sandy-Bridge IPC again. Yes, the results have bias due to setting differences, and yes, ES sample, but I doubt the differences account to 90%.

If someone has a run with more accurate settings, post and do the math [it's not hard]. Or I'll do it. I'd be VERY interested in a Titan X run, with an Intel CPU, at the same settings. I'm really starting to think we may have aimed high on IPC.

EDIT

I don't want to say something is screwy here, but AMD is using version 1.50 of the benchmark. Most of the results are showing AoS is well past version 2 [2.2 to be precise]. Am I missing something, or is AMD using an ancient version of the benchmark? And the fact they tested at a higher setting then the default for Crazy is odd to say the least. Oh, and I just saw that Half Resolution Terrain was set to off in the Ryzen results, likely dragging performance down a bit, but 90%.

Putting aside the benchmark/version difference: The Ryzen results for IPC are outright CRAP. AMD better hope this isn't indicative of Ryzen performance, otherwise it's DOA.

Calling all Titan X owners: Run the same version of AoS at the same settings. Please. Because something is seriously off here. And i want to know what.

EDIT 2

"Half" resolution terrain, not "High" resolution Terrain. That plus the sample difference are likely dragging AMD's results down. Not sure what to make of this here, as I'm being told by some people 1.50 is a newer version then 2.2. Can anyone please elaborate here?[/quotemsg]

GamerK you can't use AOTS to scale for IPC like that because it's been proven that despite being DX12 and all, it doesn't scale well above 6 cores- so performance on an Intel 6, 8 and 10 core processor is essentially flat.[/quotemsg]

I was JUST going to do a post pointing out that exact fact. So let's do the math assuming scaling drops dead after six cores, shall we?

5930k: 84.4 = IPC * 3.5 * 6
IPC = 84.4 / 3.5 / 6
IPC = ~4.02

Ryzen: 70.5 = IPC * 4 * 6
IPC = 70.5 / 4 / 6
IPC = ~2.93

Which looks a bit better, but is still of 25% from Broadwell. That puts it at about Ivy Bridge IPC. Throw in the different settings, and AMD is likely closer, likely Haswell, which is about what we've been predicting.

The REAL solution is to really divide by total CPU utilization, something like:

Performance = IPC * Clock * Number_Core / Total_CPU_Utilization

Which would account for a CPU that isn't fully loaded. And it handles cases like this better.

Just goes to show how different things look when you have a lot of CPU resources that aren't being used.
 
[quotemsg=19247422,0,133194][quotemsg=19247331,0,1282978][quotemsg=19246010,0,133194][quotemsg=19245598,0,25866]check it out:

http://wccftech.com/amd-ashes-ryzen-4-0-ghz-benchmarks/[/quotemsg]


I can do some rough math, but I don't have a 1:1 exact setting match against an Intel CPU with the Titan X on Crazy defaults. The closest I can find is:

http://www.ashesofthesingularity.com/metaverse#/personas/9ea335b6-9477-494f-8aac-190e1ba785e4/match-details/c14a6de6-6451-49c0-a141-51cbfeafec8a

Which has a lower Terrain Shadowing Sample setting [12 Million versus 16 Million], and is on a much newer version of the benchmark. I'll do the math, but it's almost certainly going to bias Intel due to the settings differences. If anyone has an Intel CPU/Titan X or can find a run with similar settings, just post and I'll re-do the results. For now, this should get a *ballpark* estimate. I'll use the average results/CPU Framerate for now.

Performance = IPC * Clock * Number of Cores

5930k: 84.4 = IPC * 3.5 * 12
IPC = 84.4 / 3.5 / 12
IPC = ~2

Ryzen: 70.5 = IPC * 4 * 16
IPC = 70.5 / 4 / 16
IPC = ~1.10

So according to these results [which I stress: BIAS INTEL due to setting difference, Ryzen has 90% lower IPC on this specific benchmark, likely due to core scaling stalling out after a few cores. Even if you factor in the bias in settings, this...isn't great.

What worries me: Remember the benches from late last year? Where I computed sub-Sandy Bridge IPC? Same thing here: Sub Sandy-Bridge IPC again. Yes, the results have bias due to setting differences, and yes, ES sample, but I doubt the differences account to 90%.

If someone has a run with more accurate settings, post and do the math [it's not hard]. Or I'll do it. I'd be VERY interested in a Titan X run, with an Intel CPU, at the same settings. I'm really starting to think we may have aimed high on IPC.

EDIT

I don't want to say something is screwy here, but AMD is using version 1.50 of the benchmark. Most of the results are showing AoS is well past version 2 [2.2 to be precise]. Am I missing something, or is AMD using an ancient version of the benchmark? And the fact they tested at a higher setting then the default for Crazy is odd to say the least. Oh, and I just saw that Half Resolution Terrain was set to off in the Ryzen results, likely dragging performance down a bit, but 90%.

Putting aside the benchmark/version difference: The Ryzen results for IPC are outright CRAP. AMD better hope this isn't indicative of Ryzen performance, otherwise it's DOA.

Calling all Titan X owners: Run the same version of AoS at the same settings. Please. Because something is seriously off here. And i want to know what.

EDIT 2

"Half" resolution terrain, not "High" resolution Terrain. That plus the sample difference are likely dragging AMD's results down. Not sure what to make of this here, as I'm being told by some people 1.50 is a newer version then 2.2. Can anyone please elaborate here?[/quotemsg]

GamerK you can't use AOTS to scale for IPC like that because it's been proven that despite being DX12 and all, it doesn't scale well above 6 cores- so performance on an Intel 6, 8 and 10 core processor is essentially flat.[/quotemsg]

I was JUST going to do a post pointing out that exact fact. So let's do the math assuming scaling drops dead after six cores, shall we?

5930k: 84.4 = IPC * 3.5 * 6
IPC = 84.4 / 3.5 / 6
IPC = ~4.02

Ryzen: 70.5 = IPC * 4 * 6
IPC = 70.5 / 4 / 6
IPC = ~2.93

Which looks a bit better, but is still of 25% from Broadwell. That puts it at about Ivy Bridge IPC. Throw in the different settings, and AMD is likely closer, likely Haswell, which is about what we've been predicting.

The REAL solution is to really divide by total CPU utilization, something like:

Performance = IPC * Clock * Number_Core / Total_CPU_Utilization

Which would account for a CPU that isn't fully loaded. And it handles cases like this better.

Just goes to show how different things look when you have a lot of CPU resources that aren't being used.[/quotemsg]

That is sorted at software level, developers would limit the amount of utilized threads in the coding and AOTS after 4 tends to go nowhere. We are not really testing IPC in that instance, we are testing threading.
 
I would like to bring up a second issue.

http://

This is a bench of a i7 6800K 6C/12T Broadwell 3.4Ghz - 3.6Ghz and the bench only reflects stock speed for all CPU's, you do not get boost clock shown, ie: if it was a real Ryzen CPU it would have shown 3.6Ghz.

Out of interest there is a i7 6800K with lower scores and less terrain scaling eg: 12 million and half resolution on with a GTX1080. So Ryzen would actually be faster than the Broadwell E Hex core if the tests were done apples to apples.
 

juanrga

Distinguished
BANNED
Mar 19, 2013
5,278
0
17,790
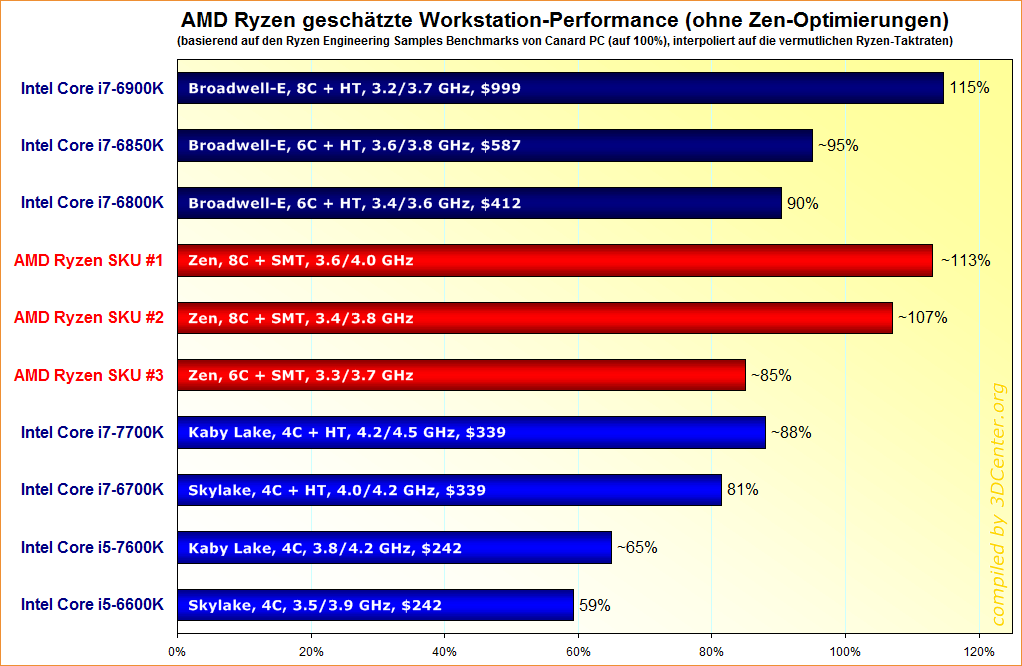
Some funny extrapolation from our friends at 3Dcenter. The first octo-core is the ZD3601BAM88F4_40/36_Y mentioned above. The second octocore is the ZD3406BAM88F4_38/34_Y mentioned above. The six-core is a ZD3301BBM6IF4_37/33_Y (I am not sure if this will be released).

AMD-Ryzen-geschaetzte-Workstation-Performance.png
 

juanrga

Distinguished
BANNED
Mar 19, 2013
5,278
0
17,790
[quotemsg=19247497,0,528675]I would like to bring up a second issue.

http://

This is a bench of a i7 6800K 6C/12T Broadwell 3.4Ghz - 3.6Ghz and the bench only reflects stock speed for all CPU's, you do not get boost clock shown, ie: if it was a real Ryzen CPU it would have shown 3.6Ghz.
[/quotemsg]

No, because the leaker wasn't testing a retail sample of Zen.
 
[quotemsg=19247508,0,1284262]Some funny extrapolation from our friends at 3Dcenter. The first octo-core is the ZD3601BAM88F4_40/36_Y mentioned above. The second octocore is the ZD3406BAM88F4_38/34_Y mentioned above. The six-core is a ZD3301BBM6IF4_37/33_Y (I am not sure if this will be released).

AMD-Ryzen-geschaetzte-Workstation-Performance.png
[/quotemsg]

I ran the numbers [using % to fill in for absolute performance], but they came out weird. Zen was about ~13.5 lower IPC then Broadwell-E, but the Skylake/Kaby Lake results looked BAD compared to both. I'm guessing these are workstation benchmarks? Because I doubt Kaby Lake is 50% slower then Broadwell (which is what the math came up with).

Hence why I prefer hard numbers, and not % difference in benchmark results.
 
I may be willing to accept the leak as real but i found truth inother stock scores,. I will post the official benches later to confirm

I7 5930 @3.5 gtx 1080 12 million samples and half detail resolution 62.3 cpu fps

I7 6800 @3.4 gtx 1080 12 million samples and half detail terrain 67.9 cpu fps

I7 6950x at 3ghz titan x pascal 12 million samples and half detail terrain 77.7 cpu fps

Ryzen at 3.6ghz titan x 16 million samples and half detail terrain off 70.5

That is 9.7% off the 6950X with far more detail and less cores and threads.

I'm beginning to believe AMD = 6900K
 

Clariska

Distinguished
Aug 6, 2012
35
1
18,535
[quotemsg=19245481,0,365092][quotemsg=19243447,0,893229]TBH i miss the old amd's 2004-2008.My psu eventually blew so while i wait on new psu for my fx.I setup my 4600+ in my main pc's case with a zalman 5x cooler and a custom made steel fan that runs on house power(don't try that at home as that fan can remove fingers/hand -_-)Clocked it from 2.4 to 2.7ghz(my gigabyte mother board doesn't support volt change :x)was hoping to get 3.2ghz out of this baby.Running with an msi 9800gt 1gb.Still plays stuff like borderlands 2 on medium details.To think where did amd go wrong altho i know why :D.

Now regarding zen.I do think the price gonna be good here in South Africa.Doubt it will come it at 12k like Intel does.My predicament are that it will cost around 3k cheaper than intel here(same with ati/nvidia.ati's usually around 3k cheaper for same performance nvidia)I do not really follow benchmarks as most benches are made for intels architecture.I prefer to do real world performance testing using frame capture software.Any ways i just hope amd delivers as i refuse to go intel with there prices .[/quotemsg]

Ah i used to own a 4800+ they were very good processors at the time i actually think they were better then the Intel dual cores back then.I expect to see a SR3 be very competitive in terms of price to a I3- low-end I5. In USA that would be 150-180$.[/quotemsg]

I actually did the test my friends running an intel E 5200 2.5 that i clocked to 2.8ghz(stock cooler)vs my amd clocked to 2.7ghz.In windows based applications the intel just kills the amd but gaming wise the amd smokes him.
.150$ is 2k my currency but they sell it for 4-6k if you don't have connections for dealer prices(Dealer price is 3k for the intel 4690k)Pretty descend but the hardware in general for intels so expensive.My asus board cost me R500 and it can do most stuff the higher boards can do just a little limited with ocing as i will most prob fry this board if i go over 4.6k ghz :D
 

juanrga

Distinguished
BANNED
Mar 19, 2013
5,278
0
17,790
[quotemsg=19247656,0,133194][quotemsg=19247508,0,1284262]Some funny extrapolation from our friends at 3Dcenter. The first octo-core is the ZD3601BAM88F4_40/36_Y mentioned above. The second octocore is the ZD3406BAM88F4_38/34_Y mentioned above. The six-core is a ZD3301BBM6IF4_37/33_Y (I am not sure if this will be released).

AMD-Ryzen-geschaetzte-Workstation-Performance.png
[/quotemsg]

I ran the numbers [using % to fill in for absolute performance], but they came out weird. Zen was about ~13.5 lower IPC then Broadwell-E, but the Skylake/Kaby Lake results looked BAD compared to both. I'm guessing these are workstation benchmarks? Because I doubt Kaby Lake is 50% slower then Broadwell (which is what the math came up with).

Hence why I prefer hard numbers, and not % difference in benchmark results.[/quotemsg]

This is an average over heavily multithreaded rendering/encoding benches: HandBrake encoding H.264 @ 1080p, HandBrake encoding H.265 @ 4K, WPrime, PovRay 3.7, Blender 3D, 3DSMax 2015 / Mental Ray, Corona Benchmark.
 

jdwii

Splendid
[quotemsg=19248706,0,1284262][quotemsg=19247656,0,133194][quotemsg=19247508,0,1284262]Some funny extrapolation from our friends at 3Dcenter. The first octo-core is the ZD3601BAM88F4_40/36_Y mentioned above. The second octocore is the ZD3406BAM88F4_38/34_Y mentioned above. The six-core is a ZD3301BBM6IF4_37/33_Y (I am not sure if this will be released).

AMD-Ryzen-geschaetzte-Workstation-Performance.png
[/quotemsg]

I ran the numbers [using % to fill in for absolute performance], but they came out weird. Zen was about ~13.5 lower IPC then Broadwell-E, but the Skylake/Kaby Lake results looked BAD compared to both. I'm guessing these are workstation benchmarks? Because I doubt Kaby Lake is 50% slower then Broadwell (which is what the math came up with).

Hence why I prefer hard numbers, and not % difference in benchmark results.[/quotemsg]

This is an average over heavily multithreaded rendering/encoding benches: HandBrake encoding H.264 @ 1080p, HandBrake encoding H.265 @ 4K, WPrime, PovRay 3.7, Blender 3D, 3DSMax 2015 / Mental Ray, Corona Benchmark.
[/quotemsg]

Looks to be 10-15% slower per cycle however most of those tests can use more than 8 cores. IPC change could be even higher then 10-15%. If SMT isn't messing up the results(WHY Couldn't this site benchmark these CPUS with SMT Off and at the same frequency) that would put Ryzen slightly below haswell which is pretty good actually but that is if SMT isn't making Ryzen's IPC look better.
 

jdwii

Splendid
http://wccftech.com/amd-ryzen-am4-processor-family-leak-r7-1800x-flagship/

"AMD Ryzen Processor Lineup Leaks Out, R7 1800X 4 GHz Flagship CPU Detailed – Up To 17 8 Core, 6 Core, 4 Core Models, 2nd March Launch"
 

8350rocks

Distinguished
[quotemsg=19247266,0,120171]Can anyone point me to a reliable source which shows that ZD3601BAM88F4_40/36_Y and 1D3601A2M88F3_3.9/3.6_N are valid part numbers? Everywhere I look but Zen leaks show the part number ending at the stepping, and Ashes of Singularity shows the name string of the cpu, not the part number. A retail/oem Ryzen, especially with final clocks, would have a name string wouldn't it?

Also, the results list on their site has no search funcionality, doesn't show the CPU unless you click the result, and is very bad at finding any specific result. If not impossible, what are the chances someone finds this specific benchmark (which was not posted anywhere else, but on the main site)?

And all of the benches around there point to version 2.x of the game. Why on earth would anyone test the latest secret AMD superweapon on a very old tool? One which is not standard like Cinebench, where it makes sense to use R11.5 for example.

I call it fake.[/quotemsg]

There are some benchmark locations that show such CPU IDs, I remember videocardz.com having some...

Link
 

8350rocks

Distinguished
[quotemsg=19250107,0,365092]http://wccftech.com/amd-ryzen-am4-processor-family-leak-r7-1800x-flagship/

"AMD Ryzen Processor Lineup Leaks Out, R7 1800X 4 GHz Flagship CPU Detailed – Up To 17 8 Core, 6 Core, 4 Core Models, 2nd March Launch"[/quotemsg]

This was posted on reddit earlier. The table of frequencies is from some no name chinese site, and is entirely speculation.

Note that they could not even get the minimum frequency stated by AMD correct with all those processors stating a low base clock of 3 GHz, when the ES out now are already minimum 3.3-3.4.

Additionally, HBM will most certainly not come on a desktop APU. That was not in the chinese speculation, and most certainly will not come to pass unless you want to spend flagship 8C ryzen money for a 4C APU. AMD will not do that.

Also, the naming scheme for the processors is not like anything I have heard. SR7 1800X? I cannot possible imagine a more random name for these processors...
 
Status
Not open for further replies.