Review WD Blue SN550 M.2 NVMe SSD Review: Best DRAMless SSD Yet

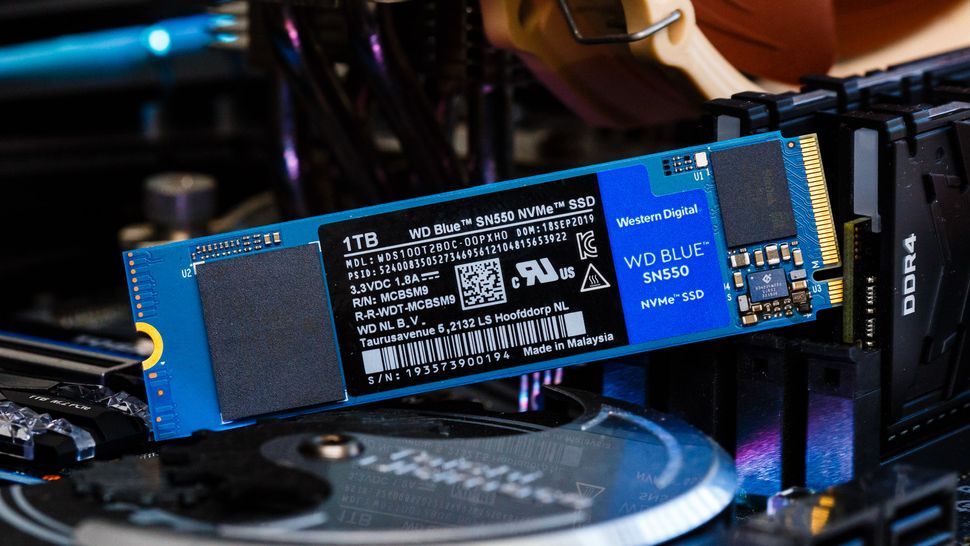
Looks like they need a little quality control over at WD. Look at all the flux left on the bottom right-hand corner (from the perspective of the picture) around all the SMD caps and diode near what I believe is the controller. Amazing that made it out of the factory like that.
 
Looks like they need a little quality control over at WD. Look at all the flux left on the bottom right-hand corner (from the perspective of the picture) around all the SMD caps and diode near what I believe is the controller. Amazing that made it out of the factory like that.
that's the point of "rock bottom cheapest ssd's anything that works is good ....


as most of cheap laptops are sold with sata ones, this is nice upgrade on the budget.
If it works that is, If such pieces end up on reviews I am afraid of what will arrive to normal consumers ...
 
that's the point of "rock bottom cheapest ssd's anything that works is good ....


as most of cheap laptops are sold with sata ones, this is nice upgrade on the budget.
If it works that is, If such pieces end up on reviews I am afraid of what will arrive to normal consumers ...

Almost looked like there was solder rework done by a rookie. I would have gotten more than my wrist slapped if I'd left something like that in one of our downhole tools. Flux can cause electrical leakage at higher temperatures.
 
with a multi-gear ECC scheme
Huh? That's the first I've ever heard of such a thing. I think that warrants an explanation.

Also, what's going on with the "Sustained Write" graphs (slide 3+, in the second group from the bottom of page 2)? I don't understand why the write speed would apparently increase, over time. I expected the graphs to bend flatter, as the drives' SLC buffers filled up. Could this be an error in the measurement methodology?
 
Looks like they need a little quality control over at WD. Look at all the flux left on the bottom right-hand corner (from the perspective of the picture) around all the SMD caps and diode near what I believe is the controller. Amazing that made it out of the factory like that.
===========================================
Can someone point out top a near-blind person which of the (7) pics it is.
Thanks
 
Huh? That's the first I've ever heard of such a thing. I think that warrants an explanation.

It's the same approach as since the WD Black NVMe (SN720 from 2018). Basically, WD's firmware optimizes the usage of multiple LDPC ECC algorithms. LDPC can take a long time to calculate when read errors are high later in the SSD's lifespan. When less ECC is needed (usually when newer/less worn), data will be retrieved using the first gear - an LDPC that aims for low power and high throughput. If the NAND is worn, then it may switch into second or third gear which increases the ECC and thus consume more power. These SSDs will utilize gear 1 most of their life.

Also, what's going on with the "Sustained Write" graphs (slide 3+, in the second group from the bottom of page 2)? I don't understand why the write speed would apparently increase, over time. I expected the graphs to bend flatter, as the drives' SLC buffers filled up. Could this be an error in the measurement methodology?
I have it exponentially scale, somewhat. Double-check the time scale/x-axis. It's the same data. I chart it this way to view how much data can be written over time from another perspective. Kind of like pattern recognition for myself, too.
 
Last edited:
  • Like
Reactions: bit_user
I have it exponentially scale, somewhat. Double-check the time scale/x-axis. It's the same data.
I hadn't noticed. I feel like it'd give a more intuitive sense of what happens to transfer speeds over time, if it were linear in both X & Y. Just my opinion.

Thanks for the reply. A lot of authors on here don't seem to read the comments - not even the first few.

Also, nice review. I was worried it might not have the synthetic benchmarks, but I was glad when I finally got to them. Personally, I care mostly about synthetics. I like when random read IOPS are tested at queue depths 1, 2, and 4, FWIW. But QD1 is what matters most.
 
Last edited:
Looks like they need a little quality control over at WD. Look at all the flux left on the bottom right-hand corner (from the perspective of the picture) around all the SMD caps and diode near what I believe is the controller. Amazing that made it out of the factory like that.

Actually, that is probably underfill for the controller which is a small CSP chip. Considering the position (close to the connector) and the size/ type of the chip, the underfill is probably laid to protect against stress (thermally induced and mechanically from insertion).
 
I hadn't noticed. I feel like it'd give a more intuitive sense of what happens to transfer speeds over time, if it were linear in both X & Y. Just my opinion.

Thanks for the reply. A lot of authors on here don't seem to read the comments - not even the first few.

Also, nice review. I was worried it might not have the synthetic benchmarks, but I was glad when I finally got to them. Personally, I care mostly about synthetics. I like when random read IOPS are tested at queue depths 1, 2, and 4, FWIW. But QD1 is what matters most.
I'll look into it. I have it compressed this way because it creates a tail whip pattern to allow me to quickly differentiate good vs bad write performance over sustained writes.

I have QD 1-128 on 4K random and 128 seq results data for manufacturer comparison. Optimally, for synthetic testing, I'd do a filesize and QD sweep like I do with enterprise stuff, but for consumers, that would be a lot of data for little value. I used to plot QD1-4 and the average before, but I just don't think it is worth plotting beyond QD1 on random because one file size doesn't always relate to what real-world performance will be like. And, performance isn't hugely different between drives in QD2-4 that it matters to show. That, and I think because the application test results speak for themselves more than anything. At the end of the day, responsiveness to real-world like use is most important.

Let me know if you would like to see any other tests/data. I'm always looking for something new and worthwhile to add. :)
 
I have QD 1-128 on 4K random and 128 seq results data for manufacturer comparison.
I saw QD1 and "peak" (didn't see where it said what QD it was at), but I didn't see any others. Did you mean QD1 & 128?

Let me know if you would like to see any other tests/data. I'm always looking for something new and worthwhile to add. :)
Well, I do like the sweep of QD, with 4k random. At least 1-4 would be nice.

I like a couple game loading benchmarks and OS booting. I guess those (and sequential, burst and sustained) are the main things I look at. That's just one data point, for you. Sorry to be boring.
 
===========================================
Can someone point out top a near-blind person which of the (7) pics it is.
Thanks

Look at the bottom right hand corner. Notice the controller surrounded by the SMD caps. Look at the ones at the bottom of that controller. See all the brown stuff coating the SMDs and in between? Notice that same brown stuff isn't anywhere else. It almost looks like someone did some solder reflow on the very corner SMD ceramic cap (there's what look like a diode there too, but too much flux coating it to tell) and didn't clean off the flux afterwards.
PMVtDTXE8tWzwm5TaYXheC-970-80.jpg
 
Because that's what it is.

That would be misleading, since it uses SRAM differently than it would use DRAM, if it had any. Calling a SRAM-based SSD makes it sound better than drives with DRAM, instead of worse (all else being equal).

that may be what it is, but what is the functional handicap of having SRAM on the controller instead of separately like DRAM might be? Or is it a different amount of memory that makes the difference? It's not clear from the article.
 
that may be what it is, but what is the functional handicap of having SRAM on the controller instead of separately like DRAM might be? Or is it a different amount of memory that makes the difference? It's not clear from the article.
I think the issue is that the manufacturer isn't clear about the tradeoff, so we just have to take the benchmarks at face value.

The reason I personally think "DRAM-less" is a better descriptor than "SRAM-based" is that SRAM is faster than DRAM. Highlighting the SRAM makes it sound better, whereas a smaller amount of SRAM is used for the sake of a cost-reduction, and it doesn't show performance that's above what DRAM-based drives are able to achieve.

Anyway, unlike the DRAM-less drives which use Host Memory Buffers, I think the DRAM-less aspect of this drive is more of a footnote.
 
While browsing through several SSD reviews on your site, focused on the power consumption graphs I noticed that the power consumption for the ADATA XPG SX8200 Pro in this review is substantially higher than in all the other reviews I found (the review of that SSD lists 4.05W max power consumption).
Is that a glitch or did you change the way you measure?
I disabled indexing and windows defender a year or so ago. Older metrics/reviews were with them enabled and substantially limiting throughout and power draw.

can it be installed on Gen3 x2, intel H410?
Yes, but it won't operate at full speed.
 
  • Like
Reactions: javiindo