News Graphics Card Power Consumption Tested: Which GPUs Slurp the Most Juice?

Page 3 - Seeking answers? Join the Tom's Hardware community: where nearly two million members share solutions and discuss the latest tech.
Just a heads up to the writer: soldering should be easy. I worry that if you struggled, that your joints may be bad.

A bad solder joint can increase resistance through a connection; this could invalidate your test results (like putting a resistor in the wires)

I assume you were soldering wires by the article; I'm sure there's plenty of videos online but simply twist the wires (see below for a great example of doing a straight connection) and apply heat to the joint, then feed the solder into the joint; you need to heat the joint (not solder) so that the solder can flow onto the joint, there is flux inside the solder (hence flux core) - that flux is needed to strip the oxide layer off the wire so that the solder will actually attach/wick into the wire. Worst case, you can apply some extra flux to the connection yourself first, but once you get the technique down, you should be able to feed in the flux from the flux core solder (and also feed solder into your joint at the same time) .. Also if adding extra flux, it's always a good idea to clean it (iso) as some fluxes can cause corrosion on the joint after if they are left on (it is afterall flux's job to eat the protective oxide layer..)
Soldering is relatively simple if you have:

  1. Experience soldering
  2. A good quality soldering iron
  3. Good solder

I almost never solder anything, so I lack all three, and the join is from a wire to the PCB. Soldering two wires together is very easy in comparison to getting a wire to solder onto a very small pin (~3mm high, maybe). But it's done, and everything seems to be working as expected. It's a learning curve, though, and one I probably won't be repeating any time soon since I have now done this and am once again left with nothing I need to solder.

Am I getting slightly skewed results from my soldering? It's possible. However, the soldering was only on the PCIe x16 slot adapter, which at most supplies 75W of power. Even if I'm off by 5% because of the soldering, that would only be 4W. Also, the power measurements tend to correlate with what I'm seeing elsewhere for Nvidia -- I measure slightly more power usually than what is shown in GPU-Z, but only by a few watts at most. Also, the Gigabyte RTX 3090 Eagle maxed out right around 350W, while the RTX 3090 FE maxed out at 365-375W. I suspect from these results and others that the GB Eagle strictly enforces a 350W TDP, while Nvidia's FE plays it a bit more loose.
 

chaz_music

Distinguished
Dec 12, 2009
86
51
18,640
Another unfortunate omission is no data on idle power, compairing the system idle without any GPU added and then just having the GPU installed at idle. With so many offload applications, it helps other determine which GPU to use for those kind of uses, such as transcoding. In many cases, the GPU with lowest idle power is the most critical metric. Does this data exist elsewhere?
 
Another unfortunate omission is no data on idle power, compairing the system idle without any GPU added and then just having the GPU installed at idle. With so many offload applications, it helps other determine which GPU to use for those kind of uses, such as transcoding. In many cases, the GPU with lowest idle power is the most critical metric. Does this data exist elsewhere?
Idle power usually doesn't vary much among desktop GPUs. The lowest are probably around 10W, the highest maybe 25W. But that's true idle. A better test would be average power use while doing normal work, like surfing the web, watching some videos, etc. But scripting all of that for testing requires a lot more effort and isn't something I've tried to do yet. I might do that in the future, however. I do have data on all of the GPUs showing power before FurMark kicks off, which is how I know most of the time it's in the <20W range. (AMD's RX 6800 XT cards had some issues at launch where idle power was around 50W I think, but that's been fixed with more recent drivers.)
 
  • Like
Reactions: King_V and VforV

VforV

Respectable
BANNED
Oct 9, 2019
578
287
2,270
Thanks for this update Jarred.(y)

I found it interesting and funny at the same time that the cards I was most interested in buying (once the prices get to more normal levels, that is) are in the top 4 cards in this list.
I was already looking at RTX 3060 Ti/3070 and RX 6700XT, but depending on the price (like I said) I will look for RX 6800 too now.

I never cared for halo products. I always consider the best purchase to be the mid-upper field, where ever is the sweet spot of best performance/efficiency/price combo. So this was exactly what I needed to know.
 

ColoradoClyde

Reputable
May 1, 2017
4
5
4,525
Thanks for the update -- this is great. One thing to note is that users of the worst offending cards (yes, that would be me and my rx580) can undervolt/underclock their cards to sacrifice a little performance for a whole lot less power. It does not take much effort with the settings available in the Radeon software. The rx580/590, in particular, were set way past the knee of the power/perforamce curve in order to try to keep up with Nvidia.
 

King_V

Illustrious
Ambassador
Thanks for the update -- this is great. One thing to note is that users of the worst offending cards (yes, that would be me and my rx580) can undervolt/underclock their cards to sacrifice a little performance for a whole lot less power. It does not take much effort with the settings available in the Radeon software. The rx580/590, in particular, were set way past the knee of the power/perforamce curve in order to try to keep up with Nvidia.

I know I've mentioned this here and there in the forums before, but, on a similar note to yours about the RX 580/590, the Vega cards, in terms of power/performance, were also done in this way. I never paid much attention to the Vega 64, but the Vega 56 review made clear that the card was pushed hard in order to outperform the GTX 1070. The review made an interesting point about undervolting the Vega56 for efficiency.
Using the secondary BIOS with a power limit reduced by 25% gets us 159.4W and 32.7 FPS. Compared to the stock settings, just 71.6% of the power consumption serves up 89% of the gaming performance.

The hierarchy chart rates the Vega 56 performance at 42.7% vs the GTX 1070's 36.7%.

89% of 42.7 is 38. Still SLIGHTLY more than the GTX 1070's 36.7, but close enough to call it a wash. But also, at a power consumption level that's just slightly higher than the GTX 1070.

In other words, the Vega 56 equal in performance, and almost as power-efficient as the GTX 1070, if using the secondary BIOS with the power limit reduced by 25%. It was only AMD's insistence on outperforming the 1070 that made it inefficient.

This may be neither here nor there, as I doubt I'll ever find a Vega 56 that's worth the price asked, and, at the time, the crypto-craze pushed Vega prices into levels best defined as "insane." I can only imagine what people are trying to get for them today, even though there are better options available.
 

salgado18

Distinguished
Feb 12, 2007
932
376
19,370
It's so funny that, when I upgrade my R9 380 to an RX 6800, I'll get a lot (four times?) more FPS for exactly the same power. Amazing what tech can do. PSU's are definitelly a long term purchase, don't go cheap on them! And thanks for the update!
 
Thanks for the update -- this is great. One thing to note is that users of the worst offending cards (yes, that would be me and my rx580) can undervolt/underclock their cards to sacrifice a little performance for a whole lot less power. It does not take much effort with the settings available in the Radeon software. The rx580/590, in particular, were set way past the knee of the power/perforamce curve in order to try to keep up with Nvidia.
This is true, and I note that the Vega cards are also running at stock voltage, which very much hurts -- but I also suspect 95% or more of Vega owners (outside of miners) run stock, because that's what most gamers do. Trying to optimize voltage and performance on every card is also a problem, as some chips simply do better than others. But Polaris and Vega are definitely getting punished for the original design decisions about voltages.
 
  • Like
Reactions: King_V
Jun 27, 2021
1
0
10
We've fully updated the charts and text to include the latest AMD RDNA2 and Nvidia Ampere GPUs. Welcome to relative parity for GPU efficiency, AMD! The GDDR6X cards are a bit more power hungry, not surprisingly.

This is certainly interesting data, but unless I missed a link on the article, I didn't see a table of the PCIe slot draw vs. the GPU power cable draw. Is this something you could please add?

Thanks!
 
This is certainly interesting data, but unless I missed a link on the article, I didn't see a table of the PCIe slot draw vs. the GPU power cable draw. Is this something you could please add?

Thanks!
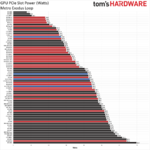
I didn't include PCIe x16 slot power draw mostly because it wasn't a problem. Every card I tested ran below the 75W thresshold, IIRC. Here's what I have at hand without spending more time.90

91

So, not surprisingly, the 3090 is near the bottom of the chart, but still only did 70W (5W to spare, plus 5% overhead would be reasonable).
 
  • Like
Reactions: Krzeszny and WTS1
Jan 7, 2022
1
0
10
Very good comparison, thank you!
Could be nice to compare the iddle power consumptions too :)
 
Jan 21, 2022
18
1
15
I have RTX 2070 Super, and the power can reach 213W but it keep dropping and cause FPS stutters/drops when the power is more than 100W , so this is a problem because i cant use my GPU at 99% usage which GPUs should be used at.
My temperatures are good for CPU and GPU when on performance.
My specs are
Gpu Asus RTX 2070 super dual
Cpu i7 9700k (so it doesnt cause bottleneck)
Ram 16gb (xmp on tried off too nothing changed)
Power supply corsair 650Watt bronze
500gb ssd
1tb hdd
Cooler nzxt kraken x63
Motherboard asus tuf z370 plus gaming
Are you running any overclocking software/utilities? If so, try shutting those off and run full stock -- sometimes the OC utilities can play poorly with the GPU.
If it's just stuttering, it might be some other setting. Have you run x264 HD Benchmark? If so, open an admin command prompt and run "bcdedit /deletevalue useplatformclock" because that setting seriously messes up performance on a lot of PCs.
Are you running "clean" -- no other windows open, all utilities off, try a single monitor, also scan for malware (Malwarebytes Anti-Malware is good for this).
Is it all games or only some games? Posting a CSV capture from HWiNFO64 would be good, as it will show all the hardware components, temps, etc.
That gives you something to start with at least.
 

Krzeszny

Distinguished
Dec 29, 2013
11
2
18,510
This is an amazing piece of work, especially considering how inconsistent software readings are, but

As a fan of spreadsheets I couldn't resist making a copy of the efficiency table in Google Sheets to add the missing GPU's using the same formulae. While the power consumption checks out, I couldn't find the source of the FPS values, despite it being explained:
the FPS comes from our GPU benchmarks hierarchy and uses the geometric mean of nine games tested at six different settings and resolution combinations (so 54 results, summarized into a single fps score)
Say again, where does the FPS come from? Where did the 9 games tested 6 times come from? It's not from where the author claims it would be (the alleged source has only 32 values per card, not 54.) But I used the available data anyway, taking the 3090 and the 6900 XT as examples. The rasterization table for the 3090 results in a geometric mean of 115.5 fps from the expected 152.7 fps, so there was a different source of data. For the 6900 XT, the geometric mean of its values is 116.5 fps with the expected value of 148.1 fps, so clearly the GPU Hierarchy rasterization table isn't the source of FPS data. The FPS values aren't from Tom's Hardware reviews either, as the 6900 XT review includes 13 games tested 3 times, while the 3090 review includes 9 games tested 2 times, neither resulting in 54 tests per card.

So it turns out we can neither validate the data from this article (as there's no valid source for the fps values) nor create our own data, while the article is outdated: missing the 4090, 7900 XTX, 6950 XT, 4080, 7900 XT, 3090 Ti, 3080 Ti, 6750 XT, A770, 6650 XT, 6600 XT, A750, 6600 (and in the future, 4070, 4060, 4050). And I just wanted to calculate the geomeans for the missing cards and post them here.
 
Last edited:
  • Like
Reactions: HungryHuy
This is an amazing piece of work, especially considering how inconsistent software readings are, but

As a fan of spreadsheets I couldn't resist making a copy of the efficiency table in Google Sheets to add the missing GPU's using the same formulae. While the power consumption checks out, I couldn't find the source of the FPS values, despite it being explained:

Say again, where does the FPS come from? Where did the 9 games tested 6 times come from? It's not from where the author claims it would be (the alleged source has only 32 values per card, not 54.) But I used the available data anyway, taking the 3090 and the 6900 XT as examples. The rasterization table for the 3090 results in a geometric mean of 115.5 fps from the expected 152.7 fps, so there was a different source of data. For the 6900 XT, the geometric mean of its values is 116.5 fps with the expected value of 148.1 fps, so clearly the GPU Hierarchy rasterization table isn't the source of FPS data. The FPS values aren't from Tom's Hardware reviews either, as the 6900 XT review includes 13 games tested 3 times, while the 3090 review includes 9 games tested 2 times, neither resulting in 54 tests per card.

So it turns out we can neither validate the data from this article (as there's no valid source for the fps values) nor create our own data, while the article is outdated: missing the 4090, 7900 XTX, 6950 XT, 4080, 7900 XT, 3090 Ti, 3080 Ti, 6750 XT, A770, 6650 XT, 6600 XT, A750, 6600 (and in the future, 4070, 4060, 4050). And I just wanted to calculate the geomeans for the missing cards and post them here.
This is an old article using data from my previous (2020-2021) test suite and system. The latest reviews all have power data included as well. Note that the power use in this article was from Metro Exodus. The most recent RX 7900 reviews contain full tables of power and performance for the entire 15-game test suite. I think I even added FPS/W in the tables.
 

Krzeszny

Distinguished
Dec 29, 2013
11
2
18,510
This is an old article using data from my previous (2020-2021) test suite and system. The latest reviews all have power data included as well. Note that the power use in this article was from Metro Exodus. The most recent RX 7900 reviews contain full tables of power and performance for the entire 15-game test suite. I think I even added FPS/W in the tables.
I know that all the reviews have the average power consumption included, and quite frankly, it's nothing special, save for the professional measuring equipment (though not FPS per Watt, I haven't seen that yet, not even in the RX 7900 XT review.) I understand that as you hadn't used used public hierarchy/review data, it's impossible to add the missing cards to this article's table without retesting them under the standardized conditions you had used, so it's pretty much impossible to update, which is a shame looking at how much work went into this. It would be the easiest to remake it using the values from the Rasterization GPU Benchmarks Hierarchy table together with power consumption from the reviews.

The (only) updated alternative to your efficiency list, except for reading reviews one-by-one and making calculations, is videocardbenchmark's list, though desktop GPU's are buried under mobile GPU's, making it hard to read, and their list is based on a synthetic benchmark (G3D Mark), being somewhat unrepresentative of gaming performance. For those interested, there is also another article from chipsandcheese comparing GPU power efficiencies in different resolutions, though it's not more up-to-date with the latest cards than this one is.
 
Last edited:
  • Like
Reactions: HungryHuy
I know that all the reviews have the average power consumption included, and quite frankly, it's nothing special, save for the professional measuring equipment (though not FPS per Watt, I haven't seen that yet, not even in the RX 7900 XT review.) I understand that as you hadn't used used public hierarchy/review data, it's impossible to add the missing cards to this article's table without retesting them under the standardized conditions you had used, so it's pretty much impossible to update, which is a shame looking at how much work went into this. It would be the easiest to remake it using the values from the Rasterization GPU Benchmarks Hierarchy table together with power consumption from the reviews.

The (only) updated alternative to your efficiency list, except for reading reviews one-by-one and making calculations, is videocardbenchmark's list, though desktop GPU's are buried under mobile GPU's, making it hard to read, and their list is based on a synthetic benchmark (G3D Mark), being somewhat unrepresentative of gaming performance. For those interested, there is also another article from chipsandcheese comparing GPU power efficiencies in different resolutions, though it's not more up-to-date with the latest cards than this one is.
The efficiency table that I included at the end of this was and is, frankly, wrong. The FPS values might be accurate as an overall measurement at the time, but the power use data is only based on testing in Metro and FurMark, which is not ideal. If every game hit the listed power draw, it would work. For older/slower GPUs, it's probably fairly close, but for newer/faster GPUs, there are lots of games that don't hit the GPU hard enough to reach the maximum TBP (or higher). I should probably revisit this whole subject with new data and proper efficiency results, using the actual performance and power use in each game.

It's funny to me that you say "all the reviews have the average power consumption included, and quite frankly, it's nothing special" but then go on to say "which is a shame looking at how much work went into this." Two years ago, when this article was first created, it was the same data that was going into reviews that also populated this article. It's never been anything more than that, but with PCAT and FrameView now working in concert, I can actually grab framerates and power for every game test. That will be nice, though presenting all of that data gets to be a bit of a mess. I could literally generate power and efficiency charts for every game, but with 15 games and four settings, that's already 60 performance charts, and I don't think it would be useful to have 120 more power and efficiency charts. Which is why I've been putting it in a table.

Here are the latest tables from the 7900 review, with the Perf/W and FPS/$ columns:

168
169
167
170
171
172
 

bit_user

Polypheme
Ambassador
I should probably revisit this whole subject with new data and proper efficiency results, using the actual performance and power use in each game.
When you do, please plot the results as a histogram for each card. As I've previously explained, averaging across multiple games misrepresents a significant portion of the data, because the distributions are fundamentally lopsided. Worse, those misrepresented samples are some of the most important, because people tend to care most about the highest/lowest values (depending whether we're talking about power or FPS).

I know you have barely enough samples to make a decent histogram, but you might check to see if you have an easy way to make a "fuzzy histogram" of the data.

Thanks!
 
Dec 30, 2022
1
1
10
The efficiency table that I included at the end of this was and is, frankly, wrong. The FPS values might be accurate as an overall measurement at the time, but the power use data is only based on testing in Metro and FurMark, which is not ideal. If every game hit the listed power draw, it would work. For older/slower GPUs, it's probably fairly close, but for newer/faster GPUs, there are lots of games that don't hit the GPU hard enough to reach the maximum TBP (or higher). I should probably revisit this whole subject with new data and proper efficiency results, using the actual performance and power use in each game.

It's funny to me that you say "all the reviews have the average power consumption included, and quite frankly, it's nothing special" but then go on to say "which is a shame looking at how much work went into this." Two years ago, when this article was first created, it was the same data that was going into reviews that also populated this article. It's never been anything more than that, but with PCAT and FrameView now working in concert, I can actually grab framerates and power for every game test. That will be nice, though presenting all of that data gets to be a bit of a mess. I could literally generate power and efficiency charts for every game, but with 15 games and four settings, that's already 60 performance charts, and I don't think it would be useful to have 120 more power and efficiency charts. Which is why I've been putting it in a table.

Here are the latest tables from the 7900 review, with the Perf/W and FPS/$ columns:

View attachment 168
View attachment 169
View attachment 167
View attachment 170
View attachment 171
View attachment 172

Hello!

Just wanted to say thank you for making the original article!

2022, power bills going up and I've used this article to hone in on the 3070 as my first GPU.

I would absolutely love for you to revisit this topic with new tools and more data, as no-one else is covering this topic even though it will be increasingly important going forwards.

I hate the trend of graphics tech just getting bigger and faster with no rhyme, reason, or regard for real world economic, spatial and thermal constraints.

Any and all serious inquires into efficiency are greatly appreciated.

Best wishes and a happy new year!
 
  • Like
Reactions: HungryHuy

3A_ITnMedia

Honorable
Mar 11, 2017
2
0
10,510
Wondering if its possible to publish the separate results for power draw (slot vs pcie cable). I did some tests on a gtx1070 card from Asus and noticed that the gpu draws most of its power from the pcie cable (reached around 98w).

A friend of mine did a test on his gtx1080 and the power draw was around 153w which is more than the rated 150w of the 8pin cable.

So, your test results are accurate, and the numbers were recorded separately. It will be really helpful to highlight this issue.

Thanks in advance.
Here are the power charts for Metro Exodus from just the PCIe slot. All the cards stay below the rated 75W, though that of course depends on the specific model you test. For example, the 'infamous' RX 480 8GB back in the day could draw something like up to 100W from the PCIe slot in some situations, but that was only for the reference card from AMD. Most 480 models properly pulled most of their power from the 8-pin connector(s).

212
 

HungryHuy

Prominent
Mar 25, 2022
2
1
515
Damn, can we just appreciate the work that Jarred has done in this article:

I keep finding myself going back (several times a year) to this article hoping for new updates with newer cards or with some of the missing cards from the RX 6000-series like such as 6600 XT, 6650 XT and 6700 non-XT. Hope they will be added in the list in the future haha :D
With the energy prices skyrocketing here in Scandinavia, Europe - Power consumption and fps per watt is very relevant for us or atleast for me. :D

AMD and Nvidia - Please hook him up with these cards!

EDIT: Woops sorry, forgot that I commented on this topic earlier haha!
 
Last edited: