The problem is, synthetic tests are not necessarily going to be representative of performance in real-world applications, especially when comparing different hardware architectures to one another. Different processor architectures are going to be faster at different things, and any single benchmark is inevitably going to favor one over another. Even when a benchmark tries to cover a wide variety of algorithms to come to its final score, the portion of the score weighted to each algorithm is not likely to be representative of any given piece of software. And not everyone makes use of the same software, so ranking processors by a single score (or pair of scores, in the case of single and multithreaded performance) in a one-size-fits-all approach is never going to produce particularly accurate results.
It tends to be much better to look at results of tests in actual software, focusing on applications that are more relevant to your needs, while downplaying those that are not. So, one should be looking through reviews, rather than just scanning some chart based on an arbitrary score derived from who knows where. Passmark seems to be pretty vague about what they are actually testing, and how that is compiled into a final score. All I can gather from their performance test page is that their CPU test "executes complex mathematical calculations involving compression, encryption and physics simulations". How relevant is that to any given user who might be browsing the web, or gaming, or editing photos, or rendering in 3D software? Probably not very.
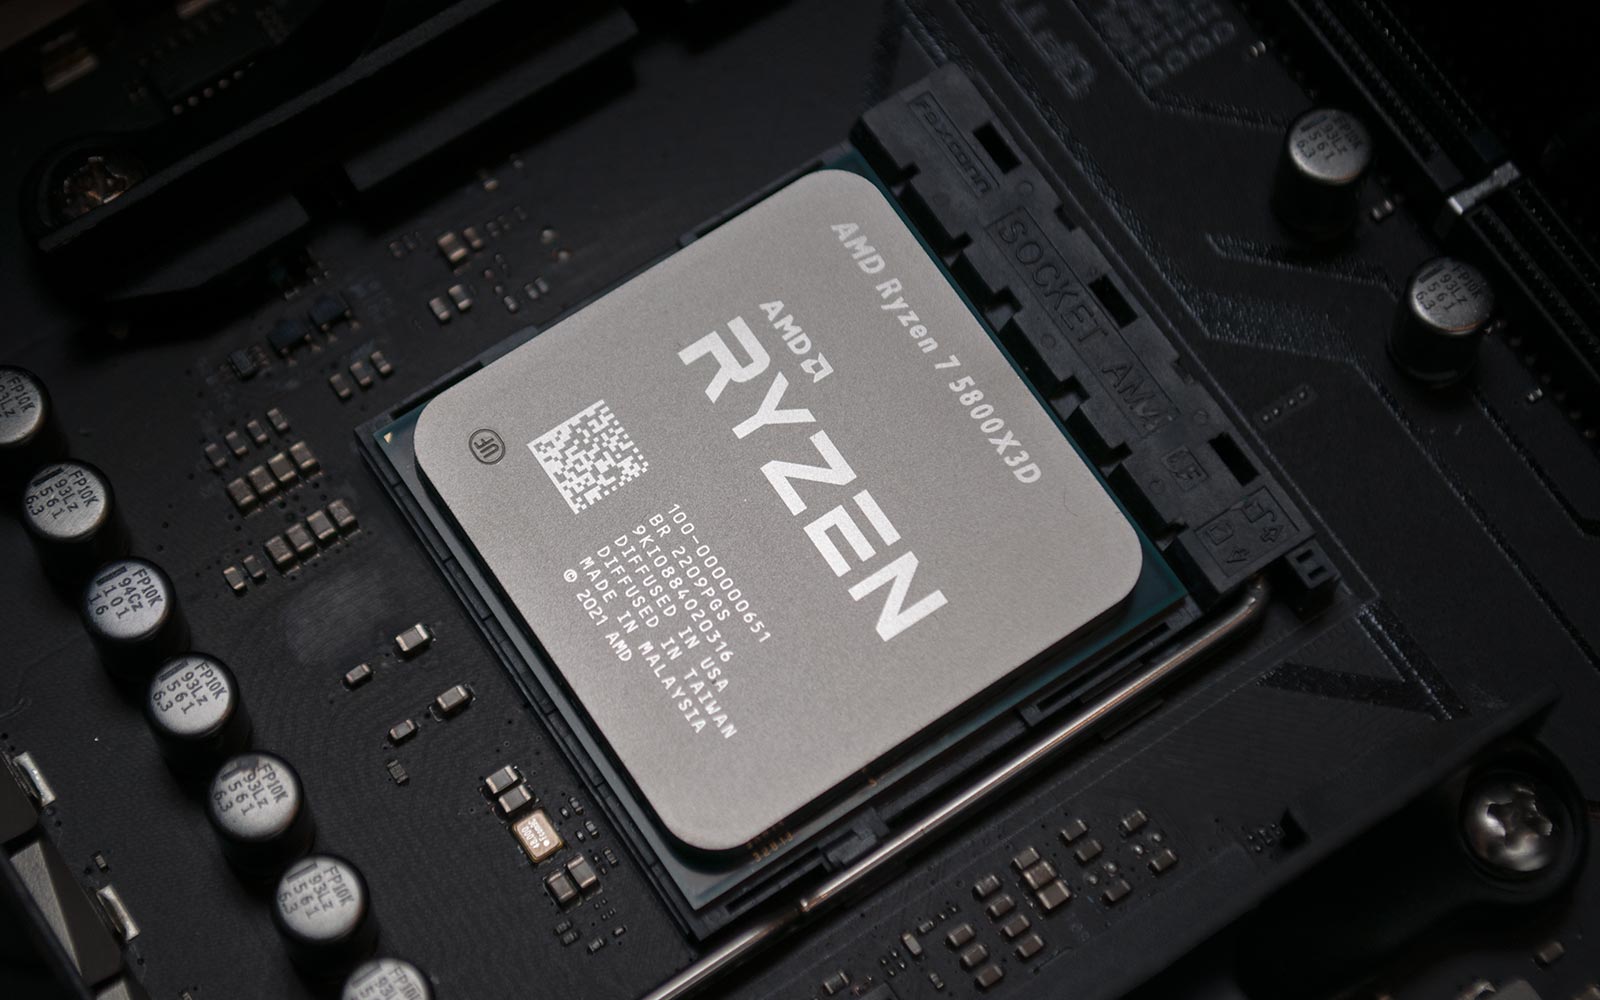
And it could be considered a similar case for this hierarchy chart at Tom's, even in the context of gaming performance. They base the numbers here on benchmark results from just a handful of games that, on average, tend to be more demanding on the CPU than most game releases. So are the results representative of the typical gaming performance that most will experience? Probably not. Nor do I expect these results to necessarily be representative of performance in future games. And I know a few of these titles show disproportionately larger gains from 3D V-Cache than what the vast majority of titles do. So I would fully expect the 5800X3D to top this chart. But outside a handful of titles, it's probably not going to be noticeably better for gaming than other processors costing significantly less.
As for a 12900KS supposedly being 71% faster than a 5800X3D in single-threaded performance according to Passmark (based on 1 sample), anyone who's looked at a review of the processor could tell you that's complete nonsense, and doesn't even come close to representing reality. There's clearly something wrong there.
And for overclocking, recent high-end CPUs don't tend to overclock much, as Intel and AMD perform binning at the factory and design the processors to reach much closer to their limits at stock. So the lack of overclocking support for the 5800X3D isn't likely to affect much.


