AMD's Future Chips & SoC's: News, Info & Rumours.

Page 13 - Seeking answers? Join the Tom's Hardware community: where nearly two million members share solutions and discuss the latest tech.
Status
Not open for further replies.


That is plain wrong and insulting me will not change that.

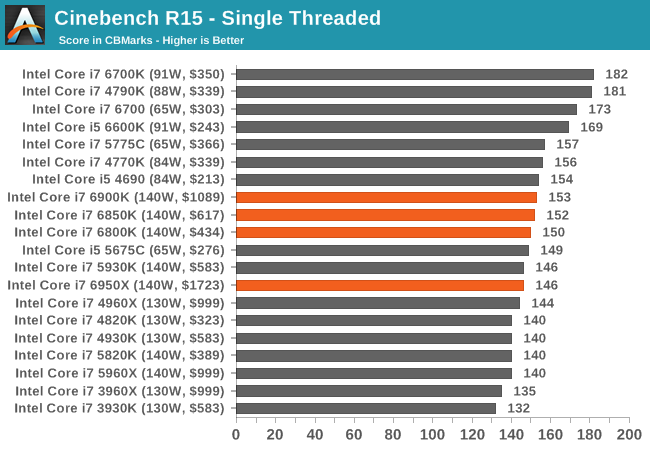
My complain was about the gap between both processors. The problem is that the Broadwell chip has lower than expected performance, whereas RyZen has higher than expected performance in the guru3D. The error is not 3%...

Neither the problem has anything to do with magic updates in RyZen microcodes invalidating data from 1800X launch reviews. If we check the ST scores that guru3D got for threadripper and the Broadwell chip, the values were 166cb and 148cb. Zen Threadripper was 12% faster in the guru3D review.

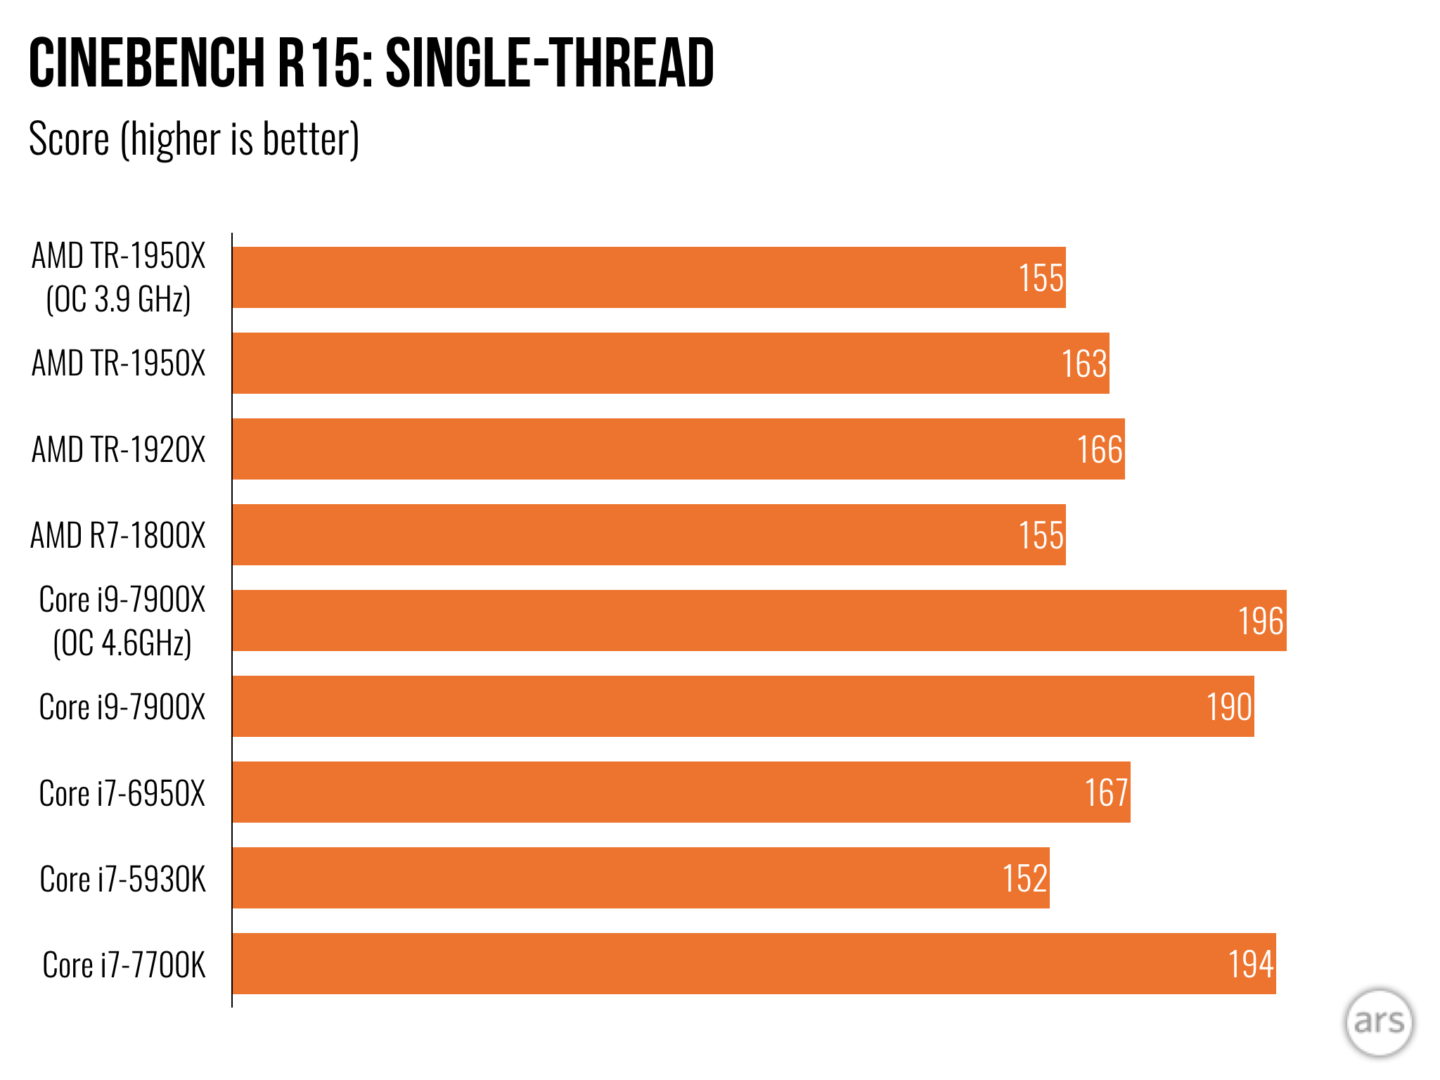
If now we check the Arstechnica review the values were 163cb and 167cb. Zen Threadripper was 2% slower in the Arstechnica review. The gap difference between both reviews is a huge 14%, and it doesn't have anything to do with magic updates in RyZen microcodes because this is the Treadripper-Broadwell gap.

The tiny difference between 166 measured in one review of ThreadRipper and 163 measured in the other is attributed to statistical variance in measurements (including settings and room temperature). But the huge variation between the 148 measured in one review and 167 measured in the other is not attributed to random effects.

Not only the guru3D review disagrees with rest of reviews, but the guru3D reviews are internally inconsistent as well. According to guru3D the Broadwell chip does 146cb @3.5GHz. Ergo it would do about 167cb at 4GHz (single-core turbo). Arstechnica measured 167cb, but guru3D measured 148cb. The values of 148cb and 146cb given in same guru3d aren't compatible.

The guru3D review is crippling the performance of the Broadwell system, either inadvertently or in purpose. Remember that reviewers can do mistakes or be biased. That is one of the reasons why we check different reviews.

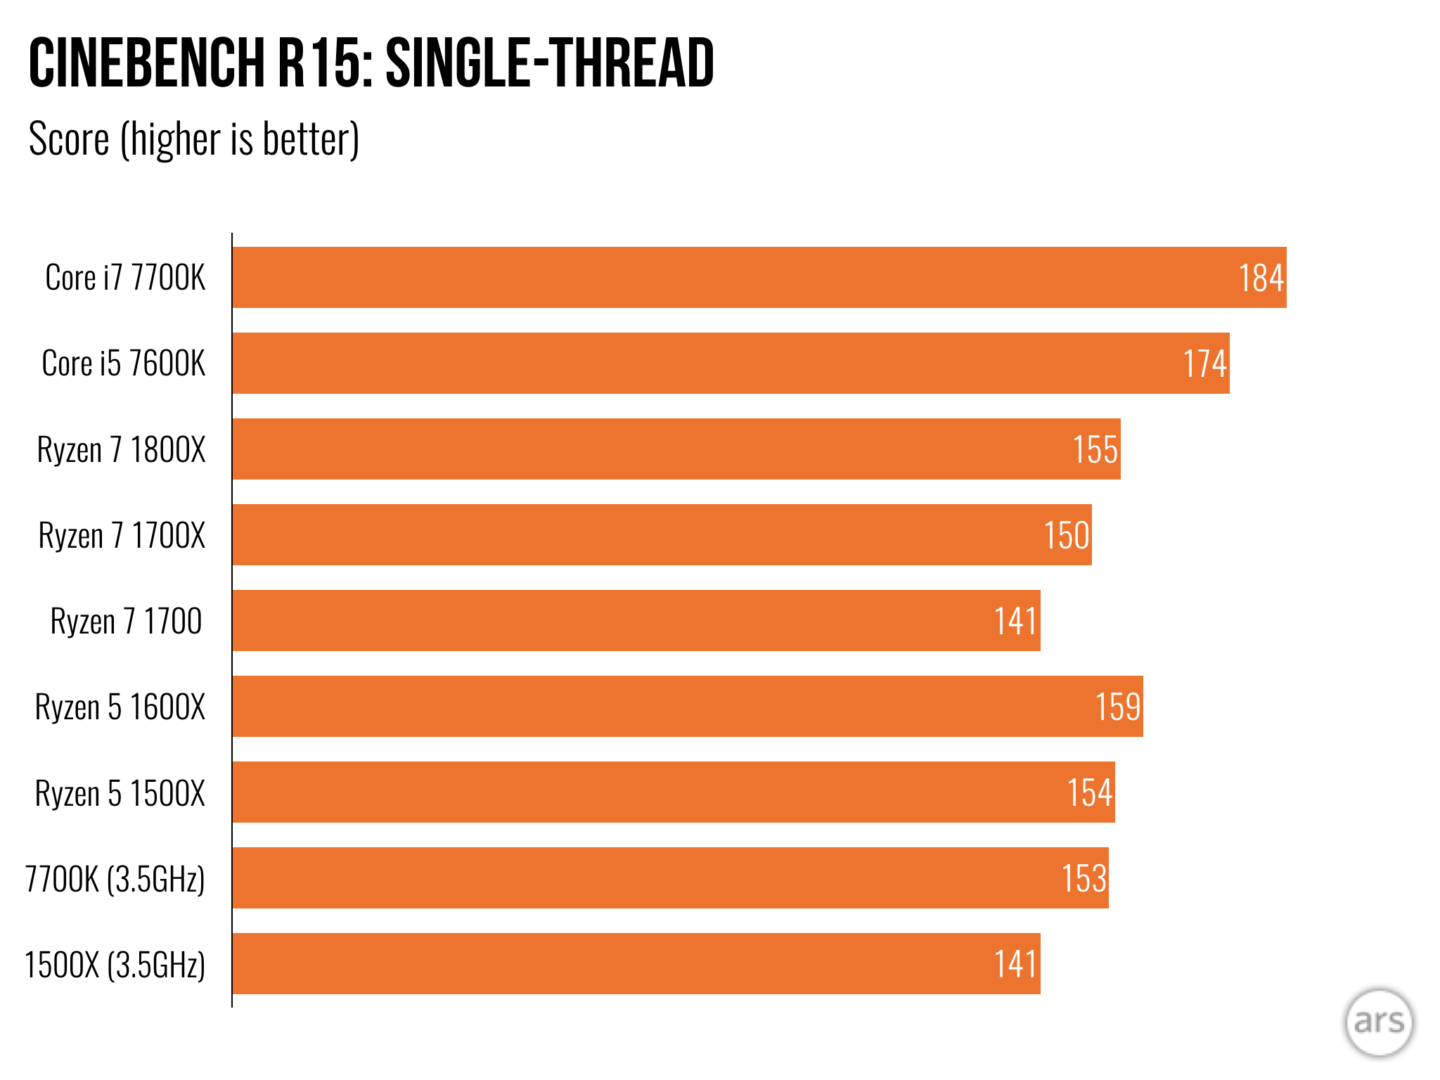
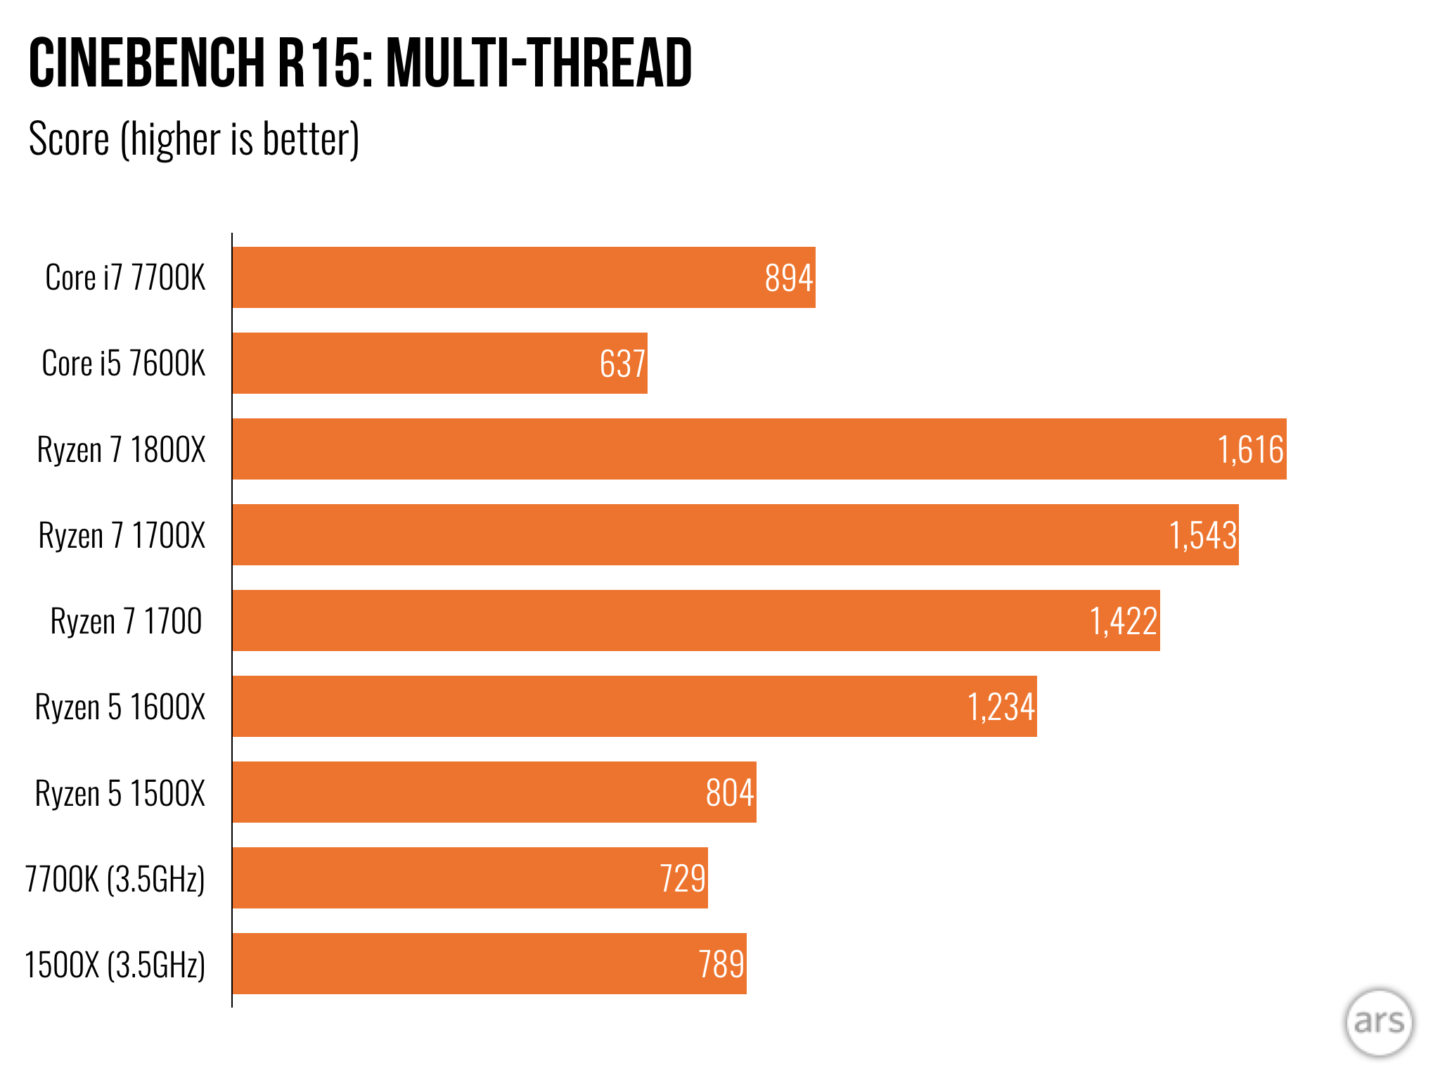
In fact if we take the recent Ars review and compare the scores for Broadwell and RyZen we can estimate the IPC gap between the 1800X and the 6950X. I obtain 7.7%, which I round to 8%.

The figure that I posted gives a IPC gap of 151/139 = 1.086, which I round to 9%.

Therefore what you call "outdated figure" is only a 1% ahead of a recentest review. This is expected because the microcode updates released for RyZen only improved latency (which doesn't apply to this benchmark) or compatibility with XMP profiles (which doesn't improve IPC).

Virtually any review of ThreadRipper has mentioned the noticeable IPC gap between microarchitecture of both companies and one flawed review from guru3D is not going to change this fact.


Broadwell at 3.5 GHz (even if we are talking different systems here):
Gruru 3D 146 CB
Your figure 151 CB
The diference is 3% and I already explained why it's perfectly plausible.

The problem is that any review not fitting your preconceived ideas you reject as wrong.


Turbo Boost 2.0 is 3,5 Ghz. Turbo Boost Max 3.0 is 4Ghz, but in some BIOS is disabled by default. Guru 3D results are perfectly consistent with Turbo Boost 2.0 and agree with many other reviews.

81823.png


I reject one review that is clearly wrong and disagrees with other reviews. And I reject claims that IPC of RyZen on CB has increased thanks to magic microcode updates, because it is not true.

To avoid dealing with Turbo 2 and Turbo 3 on Broadwell chips I will change to Kabylake, which has only one turbo policy. According to Guru3D the IPC gap between Zen (1800X) and Kabylake is 4%

152/146 = 1.04

Anandtech concluded something completely different:

As you would expect, AMD still lags in IPC to Intel, so a 4.0 GHz AMD chip can somewhat compete in single threaded tests when the Intel CPU is around 3.5-3.6 GHz, and the single thread web tests/Cinebench results show that.

4.0/3.5 = 14%
4.0/3.6 = 11%

We can average it to 12%. The PcPer review that I mentioned in the first place gives 10%, and Arstechnica gives a similar value, 11%

194/155*(4/4.5) = 1.113

Production.003-1440x1080.png


Therefore, reviews consistently give 10%, 12%, 11% between Kabylake and RyZen, whereas Guru3D gives 4%.

Moreover, your attempt to justify Guru3D results, because, in your words, "Ryzen has received several microcode improvements that have improved performance in a significant way since then" is invalid as well. In the March review of RyZen 1800X, Guru3D gives 1618cb and 156cb. In the recent ThreadRipper review Guru3D gives 1637cb and 161cb for the RyZen 1800X. The variation between both reviews is 2%, which is perfectly attributable to random errors. There was no magic IPC updates since RyZen launch up to now that can explain Guru3D weird results.

As everyone knows, AMD is a 10--20% behind Intel. About 10% in throughput workloads as CineBench and about 20% in latency workloads (including games). In the words of Arstechnica recent Threadriper review AMD "Lags behind Intel in overall IPC performance".
 
Juan,
You initially stated that broadwell numbers had been crippled by guru3D, however Guru3D 146@3,5 Anand 146@3,5 Arstechnica 167@4
All of them correspond to 41,7 CB/GHz so your theory has been debunked and guru3D review is perfectly ok

Now you switched to Kabylake
Guru3D review gets from 43,4 CB/GHz to 44 CB/GHz (depending on the kabylake model)
The same Anandtech review you mention (see figure below) gets from 40,2 to 42,4 CB/GHz
So, no, your theory that Guru3D is crippling Kabylake has also been debunked.
In fact Guru3D is actually providing higher IPC for kabylake than anandtech

So the only option for Guru3D review to be wrong is that Ryzen numbers are wrong.
Guru 3D gets from 38,9 CB/GHz to 41,7 CB/GHz again depending on the model
Anantech gets from 39,2 CB/GHz to 41,6 CB/GHz
So no, Guru3D is not showing higher IPC than anandtech for the ryzen processors.

In Sumary:
Guru3D is showing exactly the same IPC than other reviews for Broadwell
Guru 3D is showing IPCs for Ryzen in the same ranges as Anantech
Guru3D is actually showing IPCs a bit higher than anantech for Kabylake

Maybe is time to accept that Guru3D review is perfectly fine and matches data in other reviews.

86462.png

 
I originally complained about the IPC gap: "My complain was about the gap between both processors. The problem is that the Broadwell chip has lower than expected performance, whereas RyZen has higher than expected performance in the guru3D."

Your reply was that RyZen has higher scores in the new Guru3D review because "Ryzen has received several microcode improvements that have improved performance in a significant way since then". And I refuted your claim using the same Guru3D reviews you pretended were affected by magic microcode updates. As demonstrated, scores vary by 2% between the initial Guru3D review of RyZen (with launch microcode) and the recent Guru3D review (with updated microcode).

I also demonstrated that Guru3D gets lower scores for the Broadwell-E chip, but you replied it was because Guru3D didn't activate turbo 3. I then switched to Kabylake to avoid dealing with different turbo policies. And demonstrated that Guru3D continues increasing performance of AMD chips whereas crippling performance of Intel chips.

You give a benchmark from Anandtech, but Anandtech used those numbers to claim the measurement of an IPC gap between 11% and 14%:

As you would expect, AMD still lags in IPC to Intel, so a 4.0 GHz AMD chip can somewhat compete in single threaded tests when the Intel CPU is around 3.5-3.6 GHz, and the single thread web tests/Cinebench results show that.

4.0/3.5 = 14%
4.0/3.6 = 11%

The same happens with PcGamer

NP6upC8YmdVTn7bQRKjqQG-650-80.png


Using PcGamer numbers we obtain 10% for the IPC gap between Kabylake and RyZen

196/158*(4/4.5) = 1.103

Using Arstechnica review we obtain IPC gap of 11%

194/155*(4/4.5) = 1.113

Production.003-1440x1080.png


Using HardwareCanuck review we obtain IPC gap of 10%

198/160*(4/4.5) = 1.1

THREADRIPPER-37.jpg


PcPer got a 10%

clock-cb15-1.png


Therefore reviews are getting IPC gap of 11%, 14%, 10%, 11%, 10%, 10%... but Guru3D obtains 4%. It is evident which review is wrong. If you want only cite Guru3D, invent magic "microcode updates" to justify the wrong numbers on Guru3D, and ignore the rest of reviews that contradict Guru3D, do it. But please don't accuse me with "The problem is that any review not fitting your preconceived ideas you reject as wrong" because you are the only one doing that.

As mentioned by Arstechnica In the recent Threadriper review AMD "Lags behind Intel in overall IPC performance".

I don't have anything more to say about this topic.
 
I think that what you fail (or don't want) to understand is what I stated at the very beginning. Measuring performance is NOT an exact science. As I said I frequently measure performance of multiple IDENTICAL systems (same CPU model, same motherboard, same memory, same microcode, same cooler, same OS updates and same software installed since they all boot from the same disk image) at the same time and in the same room. On occasions I observe differences between them as high as 5%.

In the case of the reviews, they use different processor models (even if all are Ryzen vs Kaby-lake's) different motherboards, different memory frequencies, different coolers, different microcode updates, OS may have different updates applied and different software installed. All those factors add up and can explain even higher differences.

Let's take for instance the Guru3D figure where they measure all systems at 3.5 Ghz
index.php

The gap between the top IPC Ryzen (1800X) and the bottom IPC Kabylake (7600K) is
152/146 = 4.11%
The gap between the bottom IPC Ryzen (1200) and the top IPC Kabylake (7740X) is
154/136 = 13.24%
So actually the guru3D review is perfectly compatible with the reviews that claim around 10% gap.
The spread of the gaps is as wide as 9,13%
Curiously, you conveniently selected the 1st comparison to state your point.

We can do the same with the Anantech review and see if the gap range is as wide
86462.png

The top Ryzen (in terms of IPC) is 1500X and bottom kabylake is 7400, and the gap is:
141/154*(3.7/3.5) = -3.21%
The bottom Ryzen is 1700 and the top Kabylake is 7600K, and the gap between them is:
178/145*(3.7/4.2) = 8.14%

Wow, that must be shocking for you, the actual data (and not some general conclusions taken out of context) of the very same review you use to claim that "the IPC gap between Ryzen and Kaby lake in single thread cinebench ranges from 11% to 14%" shows that:
1) There are selected cases where some Ryzen´s show higher IPC than Kabylake
2) Even best case (for kabylake) in Anandtech review comes short of your claim, maximum gap is 8.14%
3) The spread of the gaps between best and worst case is even wider 13.35%

We can do a final exercise, compare 1800x and 7600K numbers, the only processors that appear in both reviews:
Guru3D: 152/146 = 4.11%
Anandtech: 178/160*(4/4.2) = 5.95%

A difference of 1,84% actually shows that both reviews are very very close. 1,84% is a very very small statistical variation. Specially, considering that I have shown you variations well beyond 10%.

Edit: 1700X also appears in both reviews, Guru3D gap 4,83%, Anand gap 3,85%. Difference < 1%


I've expressed the same concerns over the exact same IPC comparisons.
Review-chart-template-2017-final.003-1440x1080.png

Review-chart-template-2017-final.002-1440x1080.png

http://www.tomshardware.com/forum/id-3327589/amd-ryzen-megathread-faq-resources/page-38.html#19785131


Looking at
As stated previously, the IPC is at it's extreme points is 8.14%. "The bottom Ryzen is 1700 and the top Kabylake is 7600K, and the gap between them is:178/145*(3.7/4.2) = 8.14%" At 3.5GHz the measure is 7.8% from ars technica between the 1500X and 7700k. You also have to consider the trade off multi threaded performance vs. single thread performance. The loss in single thread performance to yield higher multi-thread performance has it's advantages. Also, take into account the better process of Intel 14nm(13nm) vs. 14nm(17nm) with a 4nm process gap makes Ryzen all that more impressive! When Ryzen hits 7nm(9.2nm) vs Intel's 10nm(9.5nm) we should see some exciting results and a much better comparison of uArch!


Glofo '7nm' is in reality a 14nm node and worse than Intel '10nm' or TSMC '10nm'.

IPC is independent of process node.


No quite... If you're able to pack more transistors for L3, L2, L1, a few bigger ALU/AGU combinations or stronger decode logic (tied to transistors), you get a better performing CPU. I'm surprised you say it is independent.

Cheers!


No. You can port RyZen from Glofo '14nm' to '7nm' and the IPC will be the same. Or you can design Zen2 core with 10% higher IPC than Zen in the same '14nm' node used for Zen.

IPC is fully independent of the process node. IPC is a property of the microarchitecture.


So you're saying Intel could make Coffee Lake in a 32nm or 45nm node and have the same overall performance?

Cheers!


performance != IPC


At IEDM Samsung, IBM and GF disclosed a CPP of 44nm and a MMP of 36nm. Intel´s 10 nm has a 54 CPP and 36 MPP. Intel reported 100 million transistors per mm2 for their 10 nm process, foundries are expected to deliver 115 to 130 million transistors per mm2. Moreover Intel 6T SRAM cell size ranges from 0,0312 um2 for their high density process to 0,0441 um2 for their high performance process. Foundries 6T SRAM size is expected to be <0,03 um2. TSMC for instance is reporting 0,027 for their high density 7nm process.

Most experts agree on the upcoming GF 7nm to have similar or better density than Intel's 10 nm.

Intel's 10nm is more similar to TSMC and GF/SS 7nm processes than to the competing 10nm processes. Even though Intel has a significant density advantage at each node the forthcoming 7nm foundry process will likely pass Intel for process density and maintain that yield for at least a few years.

Samsung and then TSMC take the lead in 2017 with their 10nm processes. Intel takes the lead back in 2017 with their 10nm process. In late 2017 TSMC will take the lead back with their 7nm before GLOBALFOUNDRIES takes the lead in 2018 with their 7nm process.


"Most experts" --> Jones

In Table 1 from your source, Jones claims the next "6T SRAM cell size - high density (um2)" values for 16/14nm

TSMC "16nm": 0.07µm²
GloFo/Samsung "14nm": 0.065μm²
Intel "14nm": 0.0588μm²

WRONG. The value he gives for Intel is the low-voltage cell size, not the the high-density cell. The full values for Intel 14nm are

High-Density SRAM: 0.0499 μm².
Low-Voltage SRAM: 0.0588 μm².
High-Performance SRAM: 0.0706 μm².

Therefore he would report 0.0499 in Table 1 of his article; instead he is giving 0.0588 and reducing Intel density lead by 18%.

You quote him saying that the forthcoming 7nm foundry process will likely pass Intel for process density, but you don't quote how he got that "likely" conclusion:

"We estimate the Intel process is ~1.7x the density of the next densest process"

"Assuming these pitches are representative of Samsung's production process and assuming a 7.5 track height we get a cell height of 270nm."

"After skipping 10nm GF is also introducing a 7nm process that will initially be optically based. We don't currently have much information on this process but believe it will be similar to the SS process possibly with a relaxed MMP to avoid quadruple patterning."

He is inventing parameters based in his personal beliefs... For instance he assumed a CPP of 44nm for SS 7nm, but the real value disclosed by Samsung is 54nm (or 23% higher than his assumption). He also estimates TSMC 10nm will have a HD SD RAM density of 0.034, but the real value provided by TSMC is 0.042 (or 24% higher than his estimation). And so on.

Also I don't buy the idea that Globalfoundries will have 7nm ready in 2018.
 
And your source is?
Oh wait, its juanrga posting in another forum 2 years ago, without any other source, and without answering the guy who asked for a source. I get an idea. Thanks.

 
This is the best science we can hope for right now!

Standard Node Trend
by Scotten Jones
Published on 07-15-2017 02:00 PM
"I have previously published analysis' converting leading edge logic processes to "standard nodes" and comparing standard nodes by company and time. Recently updated details on the 7nm process node have become available and in this article, I will revisit the standard node calculations and trends.

Traditional node names
For decades, the semiconductor industry has used nodes to describe logic processes. Down to around 500nm the node name corresponded to the physical gate length. From 500nm down to approximately 130nm the gate length shrank faster than the node names and then gate length started shrinking more slowly than the node names. With the advent of FinFETs physical gate length is now longer than the node name. Figure 1 illustrates the physical gate length divided by node name versus node."
20109d1499886145-gate-length-versus-node-jpg

"Standard Nodes
To develop a node name that is related to actual process features ASML began plotting node versus contacted poly half pitch multiplied by minimum metal half pitch. The contacted poly and minimum metal half pitches are factors in determining cell size. I have done my own version of the ASML analysis plotting node versus contacted poly pitch (CPP) multiplied by minimum metal pitch (MMP). The resulting graph for 54 processes from 12 companies is plotted in figure 2."
20110d1499886186-standard-node-versus-cpp-x-mmp-jpg

"The data in figure 2 is from 130nm to 7nm and includes the latest 7nm process data.

Using the formula derived from the plot in figure 2 I have plotted standard node versus time for 16nm/14nm, 10nm and 7nm by company and that plot is illustrated in figure 3."
20122d1499995149-standard-node-trend-1-jpg

"From figure 3 we can see that Intel's 14nm process took the node lead in 2014 with a standard node value of 12.4. Samsung's 10nm process took the lead in early 2016 with a standard node value of 11.5 and then TSMC's 10nm process took the lead in late 2016 with a standard node value of 10.0. Early this year Intel's 10nm process took the lead back with a standard node value of 8.0 and that vale is as low as any of the foundry 7nm processes.

New Standard Nodes
The problem with the original standard node formulation is it is CPP and MMP based only and does not include tracks. The height of a standard cell is actual tracks x MMP and scaling down tracks has become prevalent in recent process generations. I have now taken processes that I have CPP, MMP and track value for and plotted node versus CPP x MMP x tracks, see figure 4."
20112d1499886224-standard-node-versus-cpp-x-mmp-x-tracks-jpg

"I should note here that even CPP x MMP x tracks is not a complete metric. There are a variety of secondary effects it does not include. Intel has tried to address some of the secondary effects in a metric they have proposed but even that metric doesn't include all the routing related rules that are key to complex system on a chip designs.

Despite the limitations of CPP x MMP x tracks as a metric it is a metric I can get a reasonable amount of data on. A true comparison would need complex IP blocks to be implemented in all of the leading edge processes and data on area to be published. To the best of my knowledge that isn't available.

Figure 5 presents the new standard node values versus time for 16nm/14nm, 10nm and 7nm processes by company."
20113d1499886241-standard-node-trend-2-jpg


"From figure 5 we can see that once again Intel takes the lead in 2014 with their 14nm process with a standard node value of 12.1. Samsung and then TSMC take the lead in 2017 with their 10nm processes having standard node values of 11.2 and 10.3 respectively. Intel takes the lead back in early 2017 with their 10nm process with a new standard node value of 8.3. In late 2017 TSMC takes the lead back with their 7nm with a standard node of 7.9 before GLOBALFOUNDRIES takes the lead in early 2018 with their 7nm process with a standard node value of 7.8.

Conclusion
By either the old or the new standard node values Intel has lost their multiyear density lead over the foundries. Based on the new more accurate standard node value the average node value for Intel's 10nm and the foundry 7nm processes is 8.05nm and all four companies are within a 0.5nm standard node value of each other."

https://www.semiwiki.com/forum/content/6895-standard-node-trend.html


My sources are foundries. At least I have sources and don't invent numbers as Scotten Jones does. In fact if you pay attention to the link given, you can find that Kanter gives exactly the same 0.049um² figure that I have given for the HD cell.
 
According to Gamers Nexus, an eMail from AMD engineers to them said:
"2-3% behind Broadwell-E, 5-9% behind Kaby Lake"

Arstechnica said that is true that Ryzen's gaming performance doesn't match Intel CPUS. If your interest is solely and exclusively gaming performance, then Intel's Kaby Lake i7-7700K(and his clones) is the best chip on the market, and its price is in the same ballpark as the cheapest Ryzen, the 1700. Not even the top-end 1800X can beat the 7700K.

But the 7700K is the fastest all-round gaming processor on the market today. Being "not as fast as the 7700K" doesn't make a processor "bad" for games. It just means it's not quite as fast as literally the fastest gaming processor ever made.

For the most part, the differences between the processors are academic. In almost every case, the difference between the Ryzen and the Kaby Lake is that one has a slightly lower, but still very playable, framerate than the other. If benchmarks were showing that the Intel chips are consistently above, say, 60 frames per second while the AMD chips were consistently below, then, certainly, a good argument could be made that the Intel processor will provide a smooth gaming experience where the AMD one won't.

But generally, that's not the case. Even where the gap is quite substantial, such as Rise of the Tomb Raider, where we saw 135fps on both the Kaby Lake i7-7700K and the (eight-core/16-thread) Broadwell-E i7-6900K, the 1800X managed 110fps. That speed is still comfortably playable. Tech Report saw even more extreme differences in Doom in OpenGL mode; 170fps for the 7700K, just 123fps for the 1800X; Tech Report doesn't include the 6900K, but the 10-core/20-thread 6950K achieves 156fps. The 1800X certainly gives up some fps, but it remains perfectly playable. Switch to the newer Vulkan API instead of OpenGL and the difference evaporates away, with both the 7700K and the 1800X averaging 165fps. The 6950X, for what it's worth, is slightly behind at 161fps. But for me as a gamer that's a huge FPS gap that I can't justify.


Scotten Jones has a pretty good resume in this field, and pops right up when you google search his name! David Kanter ? What is his qualifications as an expert on the subject? I've seen him show up as a guest on Pcper claiming to be some kind of consultant... . . What kind of qualifications can you add to help improve your position, so any of us can take what you say seriously? Scotten Jones has spent in entire professional life working on in the field "His career focus has been on manufacturing and process technology."

Scotten Jones
President and Owner of IC Knowledge LLC
Greater Boston AreaSemiconductors

"Summary
I have over 33 years of experience in the semiconductor and MEMS industries beginning in process sustaining and development engineering and advancing to include P&L responsibility for a semiconductor division. I have designed, built and run wafer fabs for multiple companies, negotiated patent licenses and foundry agreements and run both internal and external development projects. I have had IT and finance responsibility and in my first 6 months as co-general manager eliminated a large cash loss by cutting costs in half at a semiconductor division. I am currently President of IC Knowledge LLC the world leader in semiconductor and MEMS cost modeling.

I am a senior member of the IEEE, have published dozens of articles and books and hold two patents in high voltage integrated circuit technology. I have served as a Board Member for the Georgetown Education Foundation a nonprofit organization dedicated to raising money to support the Georgetown Massachusetts public school system and I am very active in the Georgetown Community supporting a range of non profit groups including the PTA.

I am a lifetime member of Strathmore's Who's Who and the 2013 recipient of the Georgetown Education Foundation Partner in Education Award and the 2014 Modern Woodman Hometown Hero Award.

Specialties: Operations management, process development, information technology, facilities, cost and economics."
https://www.linkedin.com/in/scottenwjones

"Company

Picture of IC Knowledge president Scotten W Jones

IC Knowledge was formed in late 2000 by our founder and president Scotten W. Jones. Scotten (Scott) has nearly 30 years of experience in the semiconductor and MEMS industries, 18 of those in senior management positions. He holds a BS in Physics from the University of Rhode Island, has published dozens of papers, books and book length reports and holds two patents. His career focus has been on manufacturing and process technology. Scott's responsibilities have included manufacturing, engineering, IT, technology development, finance and accounting. Scott has built or upgraded several wafers fabs and has extensive experience in manufacturing execution systems, cost modeling, IP licensing agreements, outsourcing and foundry relationships. Scott's management positions have included Vice President and Co-General Manager of a Semiconductor Division, Vice President of Operations at a Semiconductor Company and Vice Presidents of Engineering and Vice President of Operations at a MEMS Company. Scott is a senior member of the IEEE and is a lifetime member of Strathmore's Who's Who. In addition to serving as President of IC Knowledge, he also serves as a Director of the Georgetown Education Foundation.

Scott's approach at IC Knowledge has been to leverage strategic partners and sub contractors to create a small company with the capabilities of a much larger organization.

Scott may be reached at: sjones@icknowledge.com"
https://www.icknowledge.com/aboutus/company.html
 
Status
Not open for further replies.